| __timestamp | Canadian National Railway Company | Carlisle Companies Incorporated |
|---|---|---|
| Wednesday, January 1, 2014 | 7142000000 | 2384500000 |
| Thursday, January 1, 2015 | 6951000000 | 2536500000 |
| Friday, January 1, 2016 | 6362000000 | 2518100000 |
| Sunday, January 1, 2017 | 7366000000 | 2941900000 |
| Monday, January 1, 2018 | 8359000000 | 3304800000 |
| Tuesday, January 1, 2019 | 8832000000 | 3439900000 |
| Wednesday, January 1, 2020 | 8048000000 | 2832500000 |
| Friday, January 1, 2021 | 8408000000 | 3495600000 |
| Saturday, January 1, 2022 | 9711000000 | 4434500000 |
| Sunday, January 1, 2023 | 9677000000 | 3042900000 |
| Monday, January 1, 2024 | 3115900000 |
Unlocking the unknown
In the ever-evolving landscape of North American industry, the cost of revenue is a critical metric that reflects operational efficiency and market adaptability. Over the past decade, Canadian National Railway Company (CNR) and Carlisle Companies Incorporated have showcased distinct trajectories in their cost structures. From 2014 to 2023, CNR's cost of revenue has seen a steady increase, peaking in 2022 with a 53% rise from its 2016 low. This growth underscores CNR's expansive operations and strategic investments in infrastructure.
Conversely, Carlisle Companies has experienced a more volatile pattern, with a notable 86% surge in 2022 compared to 2014, highlighting its aggressive expansion and diversification strategies. These trends not only reflect the companies' internal strategies but also the broader economic shifts impacting the transportation and manufacturing sectors. As we look to the future, understanding these cost dynamics will be crucial for stakeholders and investors alike.

Cost of Revenue Trends: Canadian National Railway Company vs EMCOR Group, Inc.

Analyzing Cost of Revenue: Canadian National Railway Company and Masco Corporation

Comparing Cost of Revenue Efficiency: Canadian National Railway Company vs Snap-on Incorporated
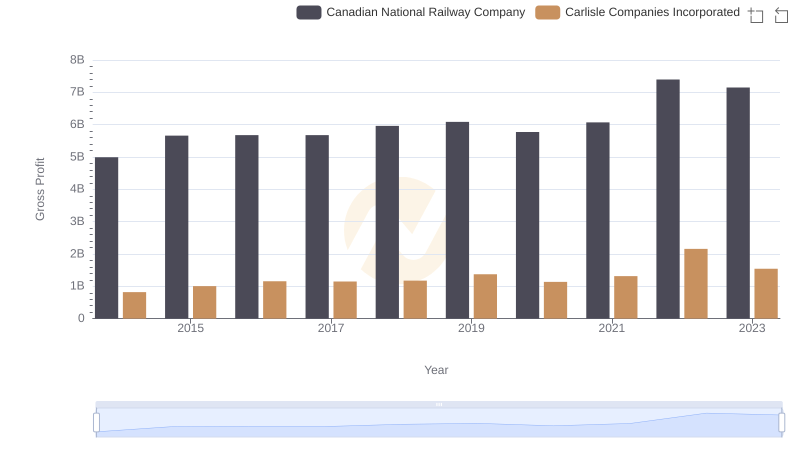
Gross Profit Analysis: Comparing Canadian National Railway Company and Carlisle Companies Incorporated