| __timestamp | Canadian National Railway Company | Snap-on Incorporated |
|---|---|---|
| Wednesday, January 1, 2014 | 7142000000 | 1693400000 |
| Thursday, January 1, 2015 | 6951000000 | 1704500000 |
| Friday, January 1, 2016 | 6362000000 | 1720800000 |
| Sunday, January 1, 2017 | 7366000000 | 1862000000 |
| Monday, January 1, 2018 | 8359000000 | 1870700000 |
| Tuesday, January 1, 2019 | 8832000000 | 1886000000 |
| Wednesday, January 1, 2020 | 8048000000 | 1844000000 |
| Friday, January 1, 2021 | 8408000000 | 2141200000 |
| Saturday, January 1, 2022 | 9711000000 | 2311700000 |
| Sunday, January 1, 2023 | 9677000000 | 2488500000 |
| Monday, January 1, 2024 | 2329500000 |
Unlocking the unknown
In the world of industrial efficiency, Canadian National Railway Company (CNR) and Snap-on Incorporated stand as titans, each with a unique approach to managing costs. Over the past decade, CNR has consistently demonstrated its prowess, with its cost of revenue peaking at approximately 9.7 billion USD in 2022, a 52% increase from 2016. This growth reflects CNR's strategic investments in infrastructure and technology, enhancing its operational efficiency.
Conversely, Snap-on Incorporated, a leader in the tool manufacturing industry, has shown a steady yet modest increase in its cost of revenue, reaching around 2.5 billion USD in 2023. This represents a 47% rise since 2014, underscoring Snap-on's commitment to innovation and quality.
These figures highlight the contrasting strategies of two industry leaders, offering valuable insights into how different sectors manage their cost structures to drive growth and maintain competitiveness.
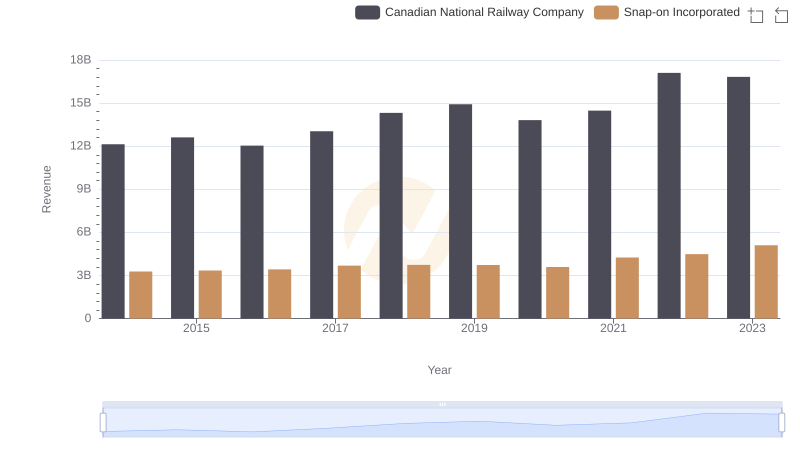
Who Generates More Revenue? Canadian National Railway Company or Snap-on Incorporated

Analyzing Cost of Revenue: Canadian National Railway Company and Masco Corporation
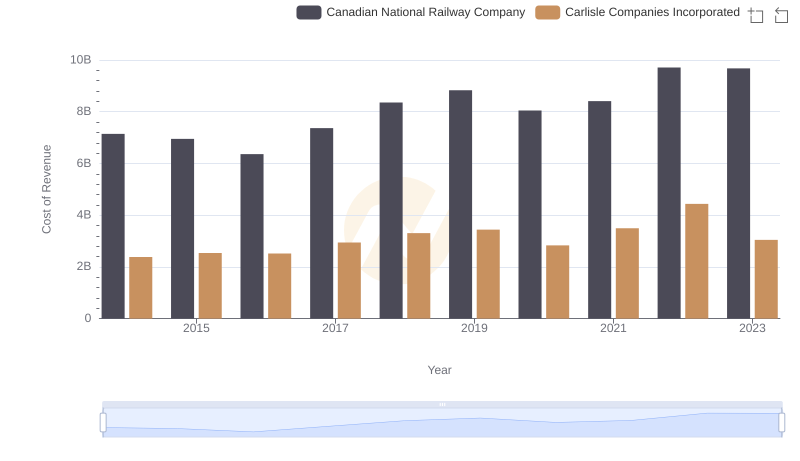
Cost of Revenue Comparison: Canadian National Railway Company vs Carlisle Companies Incorporated
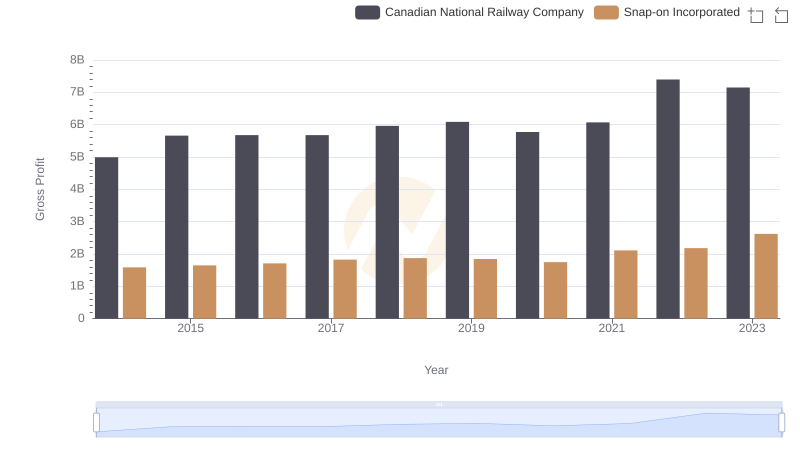
Gross Profit Trends Compared: Canadian National Railway Company vs Snap-on Incorporated