| __timestamp | Canadian National Railway Company | EMCOR Group, Inc. |
|---|---|---|
| Wednesday, January 1, 2014 | 7142000000 | 5517719000 |
| Thursday, January 1, 2015 | 6951000000 | 5774247000 |
| Friday, January 1, 2016 | 6362000000 | 6513662000 |
| Sunday, January 1, 2017 | 7366000000 | 6539987000 |
| Monday, January 1, 2018 | 8359000000 | 6925178000 |
| Tuesday, January 1, 2019 | 8832000000 | 7818743000 |
| Wednesday, January 1, 2020 | 8048000000 | 7401679000 |
| Friday, January 1, 2021 | 8408000000 | 8401843000 |
| Saturday, January 1, 2022 | 9711000000 | 9472526000 |
| Sunday, January 1, 2023 | 9677000000 | 10493534000 |
Unlocking the unknown
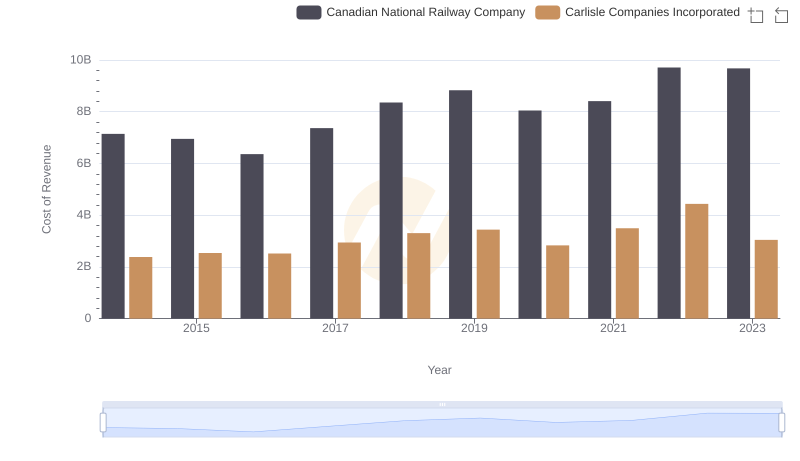
In the ever-evolving landscape of North American industries, the cost of revenue is a critical metric that reflects operational efficiency and market dynamics. From 2014 to 2023, Canadian National Railway Company and EMCOR Group, Inc. have showcased intriguing trends in their cost of revenue.
Canadian National Railway Company, a titan in the transportation sector, has seen its cost of revenue fluctuate, peaking in 2022 with a 53% increase from its 2016 low. Meanwhile, EMCOR Group, Inc., a leader in construction and facilities services, experienced a steady rise, culminating in a 90% increase over the same period.
These trends highlight the resilience and adaptability of these companies amidst economic shifts. As we delve deeper into these figures, it becomes evident that strategic management and market positioning play pivotal roles in navigating the complexities of cost management.