| __timestamp | Canadian National Railway Company | Masco Corporation |
|---|---|---|
| Wednesday, January 1, 2014 | 7142000000 | 6134000000 |
| Thursday, January 1, 2015 | 6951000000 | 4889000000 |
| Friday, January 1, 2016 | 6362000000 | 4901000000 |
| Sunday, January 1, 2017 | 7366000000 | 5033000000 |
| Monday, January 1, 2018 | 8359000000 | 5670000000 |
| Tuesday, January 1, 2019 | 8832000000 | 4336000000 |
| Wednesday, January 1, 2020 | 8048000000 | 4601000000 |
| Friday, January 1, 2021 | 8408000000 | 5512000000 |
| Saturday, January 1, 2022 | 9711000000 | 5967000000 |
| Sunday, January 1, 2023 | 9677000000 | 5131000000 |
| Monday, January 1, 2024 | 4997000000 |
Igniting the spark of knowledge
In the world of transportation and home improvement, Canadian National Railway Company and Masco Corporation stand as titans. Over the past decade, from 2014 to 2023, these companies have showcased intriguing trends in their cost of revenue. Canadian National Railway Company has seen a steady increase, with a notable 36% rise from 2014 to 2023. This growth reflects the company's robust expansion and operational efficiency. In contrast, Masco Corporation experienced fluctuations, with a peak in 2014 and a dip in 2019, before stabilizing in recent years. This variability highlights the challenges and dynamic nature of the home improvement sector. As we delve into these insights, it becomes evident that understanding cost structures is crucial for investors and stakeholders aiming to navigate these industries successfully.

Cost of Revenue Trends: Canadian National Railway Company vs EMCOR Group, Inc.
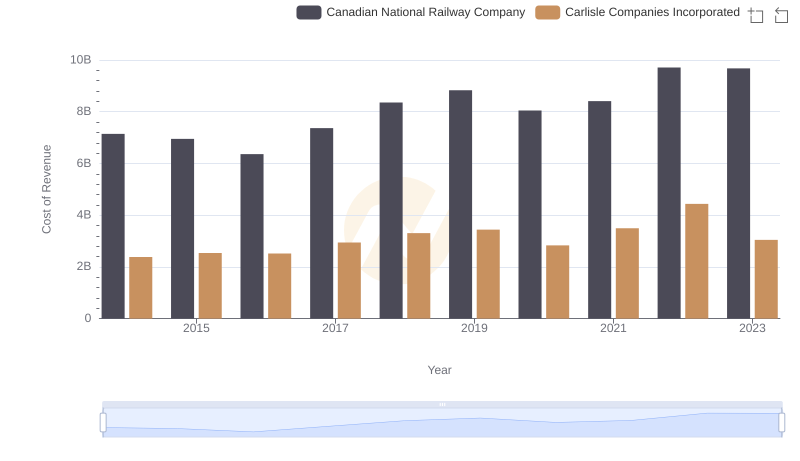
Cost of Revenue Comparison: Canadian National Railway Company vs Carlisle Companies Incorporated

Comparing Cost of Revenue Efficiency: Canadian National Railway Company vs Snap-on Incorporated
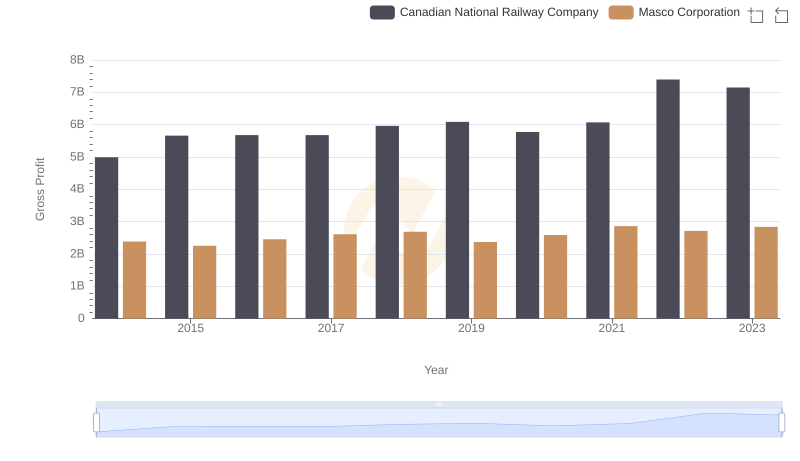
Gross Profit Analysis: Comparing Canadian National Railway Company and Masco Corporation