| __timestamp | Arista Networks, Inc. | Fiserv, Inc. |
|---|---|---|
| Wednesday, January 1, 2014 | 137809000 | 1614000000 |
| Thursday, January 1, 2015 | 162832000 | 1728000000 |
| Friday, January 1, 2016 | 265110000 | 1856000000 |
| Sunday, January 1, 2017 | 498180000 | 1961000000 |
| Monday, January 1, 2018 | 318202000 | 2300000000 |
| Tuesday, January 1, 2019 | 838623000 | 3126000000 |
| Wednesday, January 1, 2020 | 699684000 | 4963000000 |
| Friday, January 1, 2021 | 975073000 | 5392000000 |
| Saturday, January 1, 2022 | 1589806000 | 6636000000 |
| Sunday, January 1, 2023 | 2327879000 | 7813000000 |
| Monday, January 1, 2024 | 2944616000 | 5879000000 |
Igniting the spark of knowledge
In the ever-evolving tech landscape, Arista Networks and Fiserv have emerged as formidable players. Over the past decade, from 2014 to 2023, both companies have demonstrated impressive EBITDA growth, a key indicator of financial health. Arista Networks, starting with a modest EBITDA in 2014, has seen a staggering increase of over 1,500% by 2023. Meanwhile, Fiserv, a leader in financial services technology, has consistently outpaced Arista, boasting a 380% growth in the same period.
This analysis highlights the dynamic growth trajectories of these industry giants, offering valuable insights for investors and stakeholders.

Revenue Insights: Arista Networks, Inc. and Fiserv, Inc. Performance Compared
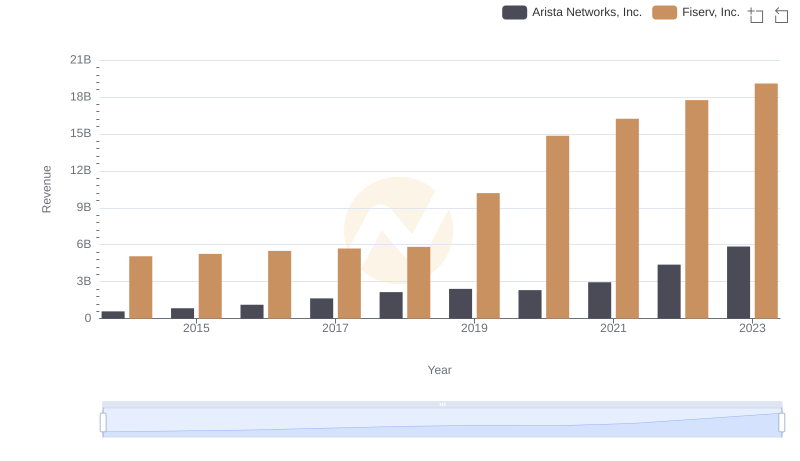
Arista Networks, Inc. vs Fiserv, Inc.: Examining Key Revenue Metrics

Cost of Revenue Comparison: Arista Networks, Inc. vs Fiserv, Inc.
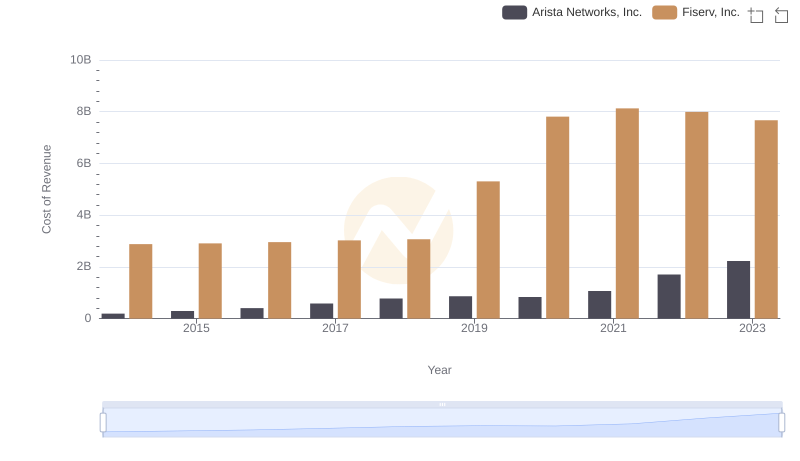
Analyzing Cost of Revenue: Arista Networks, Inc. and Fiserv, Inc.

Who Generates Higher Gross Profit? Arista Networks, Inc. or Fiserv, Inc.
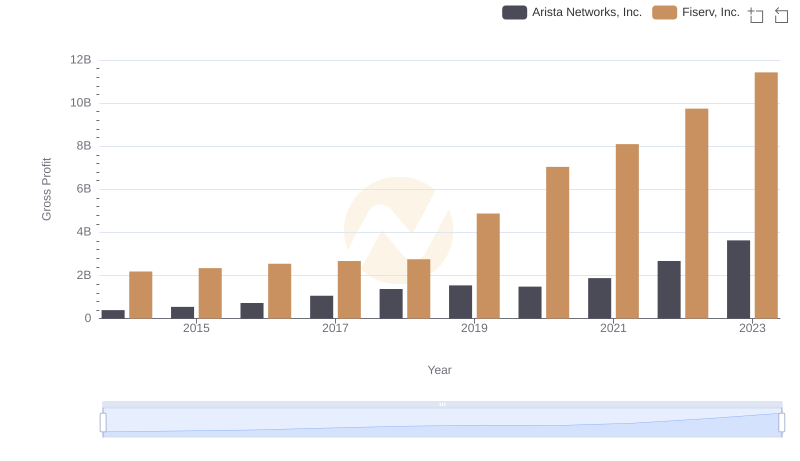
Key Insights on Gross Profit: Arista Networks, Inc. vs Fiserv, Inc.
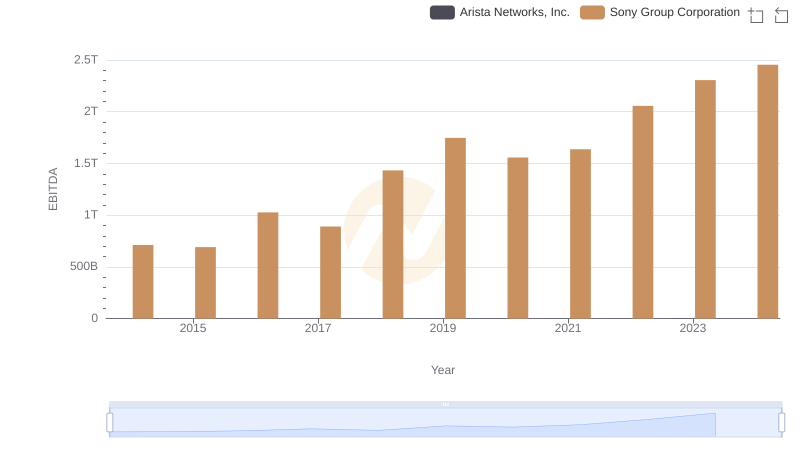
Arista Networks, Inc. and Sony Group Corporation: A Detailed Examination of EBITDA Performance

Cost Management Insights: SG&A Expenses for Arista Networks, Inc. and Fiserv, Inc.
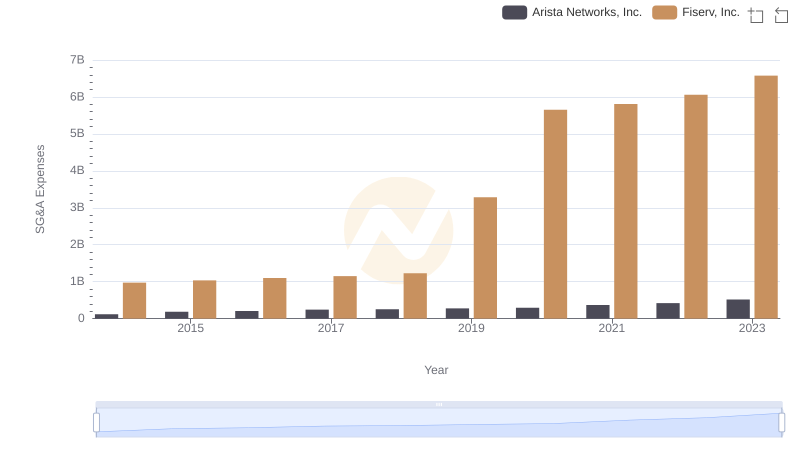
Cost Management Insights: SG&A Expenses for Arista Networks, Inc. and Fiserv, Inc.
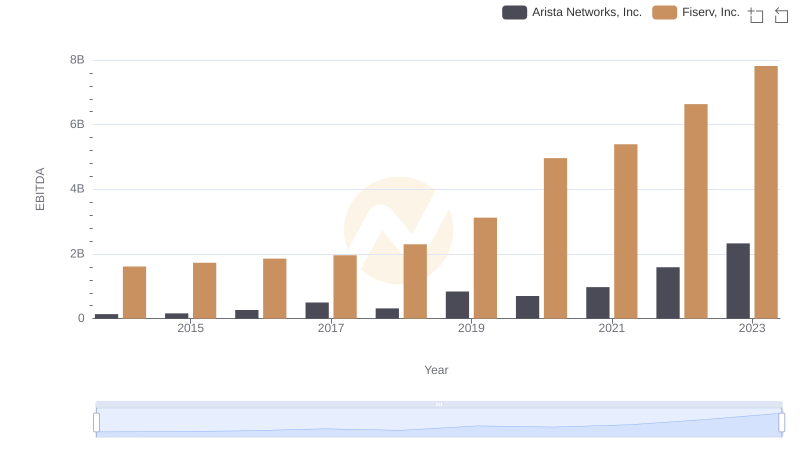
Arista Networks, Inc. vs Fiserv, Inc.: In-Depth EBITDA Performance Comparison

Comprehensive EBITDA Comparison: Arista Networks, Inc. vs Micron Technology, Inc.
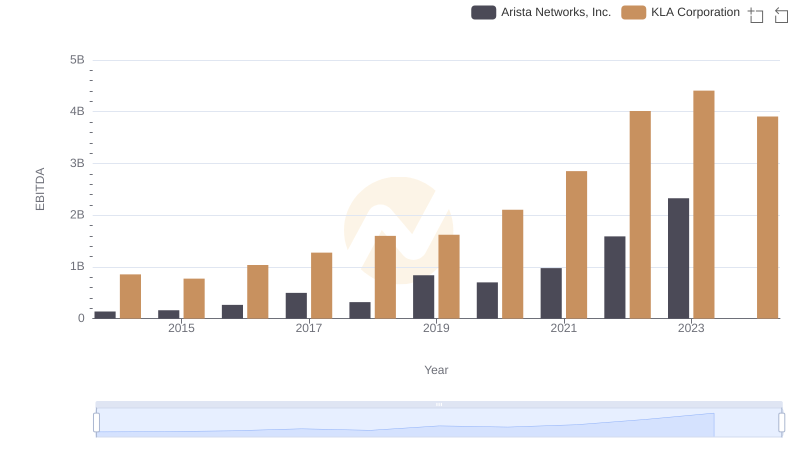
Arista Networks, Inc. and KLA Corporation: A Detailed Examination of EBITDA Performance