| __timestamp | Arista Networks, Inc. | Fiserv, Inc. |
|---|---|---|
| Wednesday, January 1, 2014 | 117669000 | 975000000 |
| Thursday, January 1, 2015 | 184804000 | 1034000000 |
| Friday, January 1, 2016 | 206126000 | 1101000000 |
| Sunday, January 1, 2017 | 241903000 | 1150000000 |
| Monday, January 1, 2018 | 252562000 | 1228000000 |
| Tuesday, January 1, 2019 | 275805000 | 3284000000 |
| Wednesday, January 1, 2020 | 295608000 | 5652000000 |
| Friday, January 1, 2021 | 369288000 | 5810000000 |
| Saturday, January 1, 2022 | 420196000 | 6059000000 |
| Sunday, January 1, 2023 | 518114000 | 6576000000 |
| Monday, January 1, 2024 | 549970000 | 6564000000 |
Igniting the spark of knowledge
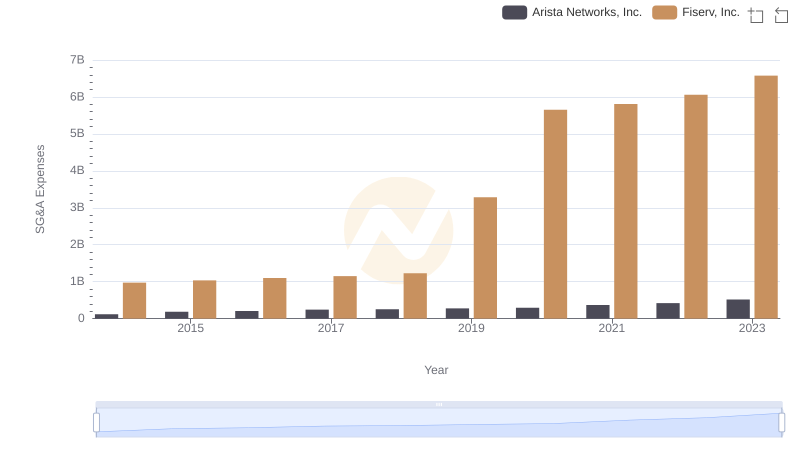
In the dynamic world of corporate finance, managing Selling, General, and Administrative (SG&A) expenses is crucial for maintaining profitability. This analysis delves into the SG&A trends of Arista Networks, Inc. and Fiserv, Inc. over the past decade, from 2014 to 2023.
Arista Networks, Inc. has seen a steady increase in SG&A expenses, growing by approximately 340% over this period. Starting at around $118 million in 2014, their expenses have surged to over $518 million by 2023. This growth reflects Arista's strategic investments in scaling operations and expanding market reach.
Conversely, Fiserv, Inc. experienced a more dramatic rise, with SG&A expenses increasing by nearly 575%, from $975 million in 2014 to a staggering $6.576 billion in 2023. This significant uptick underscores Fiserv's aggressive expansion and integration strategies in the financial services sector.

Revenue Insights: Arista Networks, Inc. and Fiserv, Inc. Performance Compared
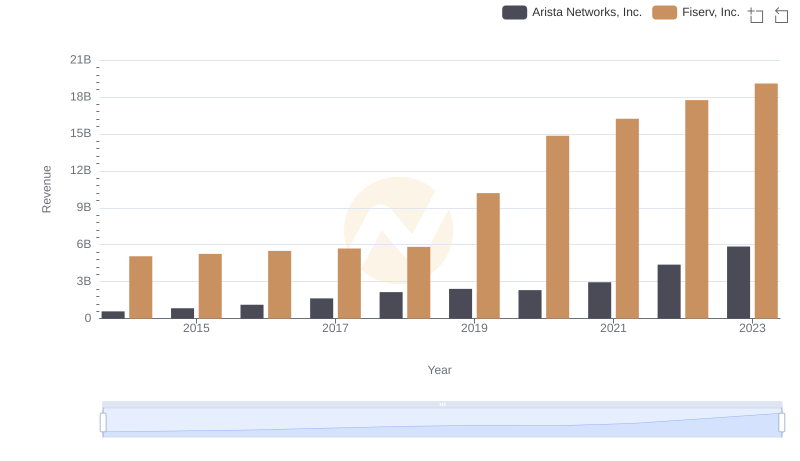
Arista Networks, Inc. vs Fiserv, Inc.: Examining Key Revenue Metrics

Cost of Revenue Comparison: Arista Networks, Inc. vs Fiserv, Inc.
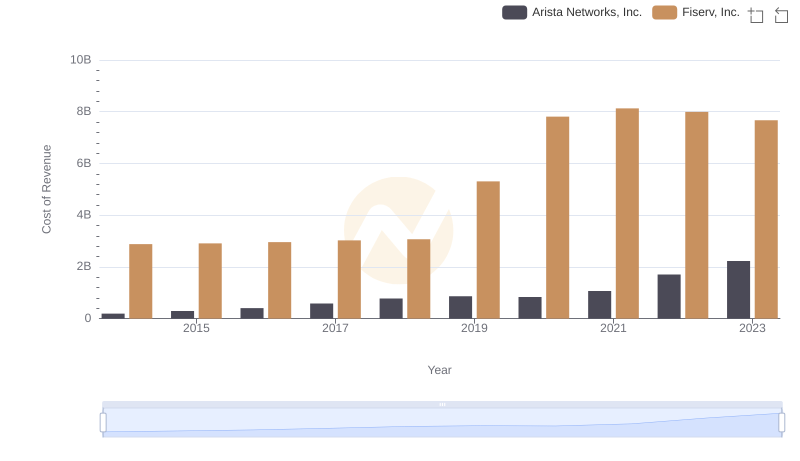
Analyzing Cost of Revenue: Arista Networks, Inc. and Fiserv, Inc.
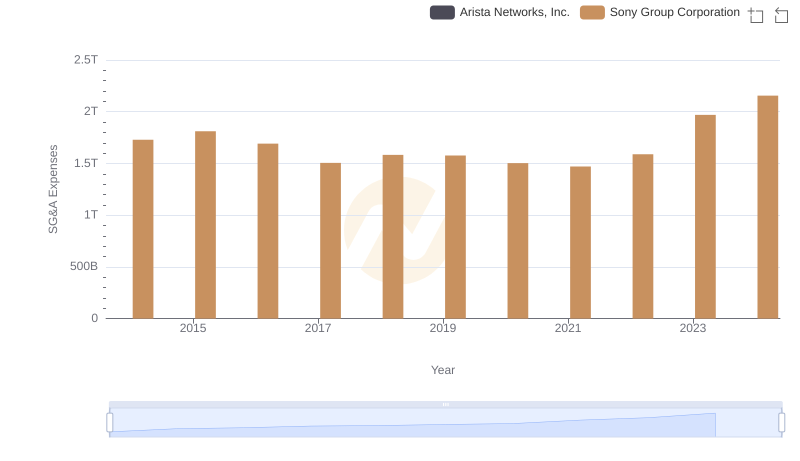
Comparing SG&A Expenses: Arista Networks, Inc. vs Sony Group Corporation Trends and Insights

Who Generates Higher Gross Profit? Arista Networks, Inc. or Fiserv, Inc.
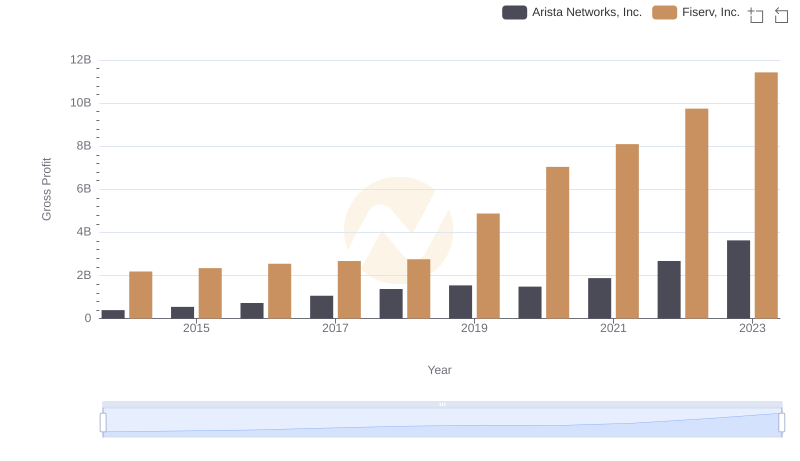
Key Insights on Gross Profit: Arista Networks, Inc. vs Fiserv, Inc.
Cost Management Insights: SG&A Expenses for Arista Networks, Inc. and Fiserv, Inc.

EBITDA Analysis: Evaluating Arista Networks, Inc. Against Fiserv, Inc.
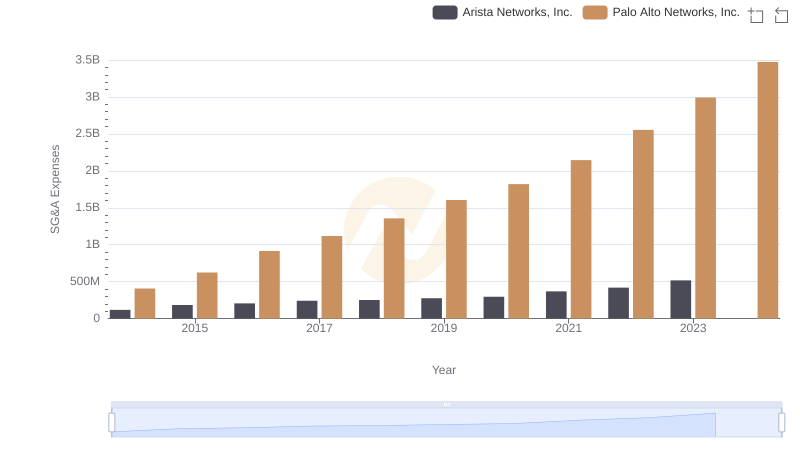
SG&A Efficiency Analysis: Comparing Arista Networks, Inc. and Palo Alto Networks, Inc.
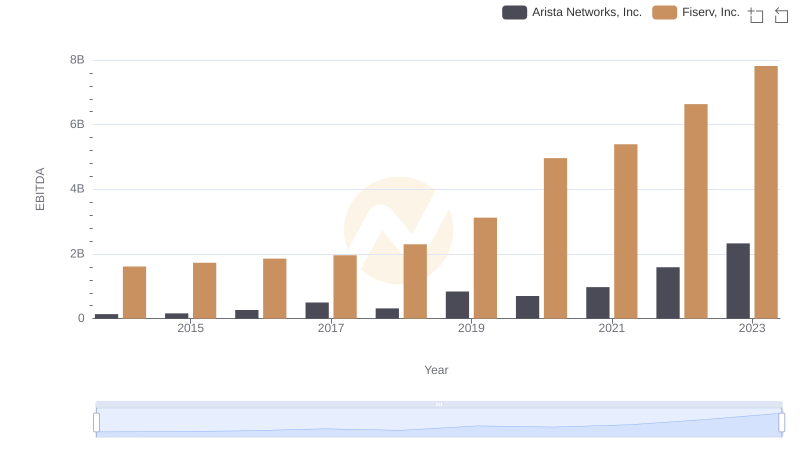
Arista Networks, Inc. vs Fiserv, Inc.: In-Depth EBITDA Performance Comparison
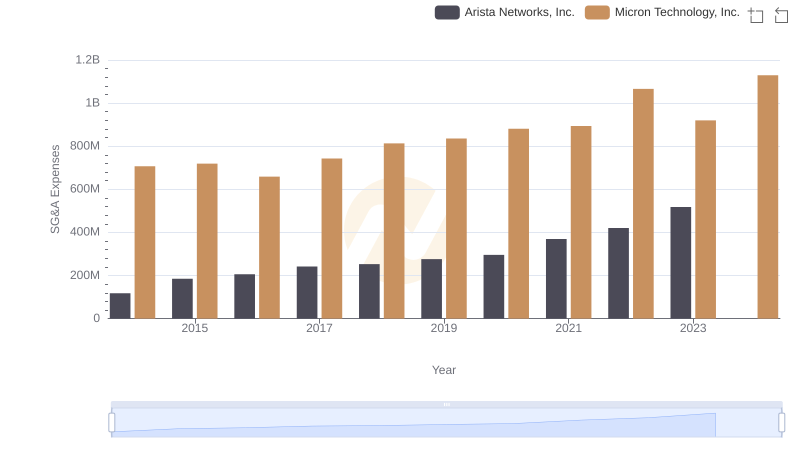
Comparing SG&A Expenses: Arista Networks, Inc. vs Micron Technology, Inc. Trends and Insights