| __timestamp | Eaton Corporation plc | Global Payments Inc. |
|---|---|---|
| Wednesday, January 1, 2014 | 6906000000 | 1751611000 |
| Thursday, January 1, 2015 | 6563000000 | 1750511000 |
| Friday, January 1, 2016 | 6347000000 | 1767444000 |
| Sunday, January 1, 2017 | 6648000000 | 2047126000 |
| Monday, January 1, 2018 | 7098000000 | 2271352000 |
| Tuesday, January 1, 2019 | 7052000000 | 2838089000 |
| Wednesday, January 1, 2020 | 5450000000 | 3772831000 |
| Friday, January 1, 2021 | 6335000000 | 4750037000 |
| Saturday, January 1, 2022 | 6887000000 | 5196898000 |
| Sunday, January 1, 2023 | 8433000000 | 5926898000 |
| Monday, January 1, 2024 | 9503000000 | 6345778000 |
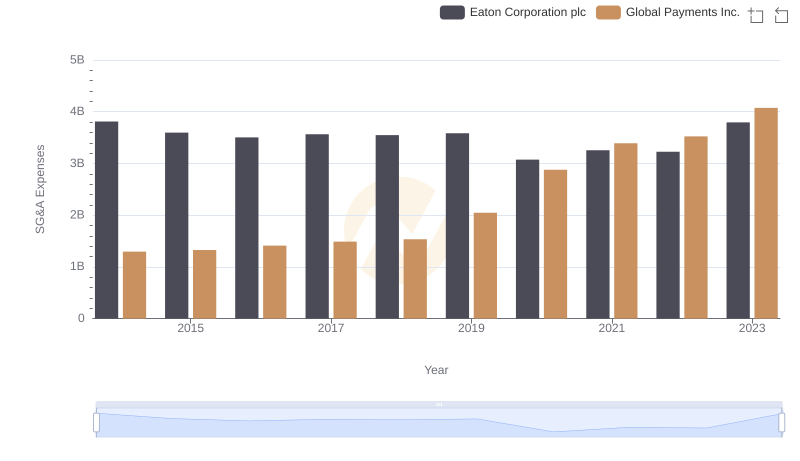
Data in motion
In the ever-evolving landscape of global business, understanding the financial health of industry leaders is crucial. This analysis delves into the gross profit trends of Eaton Corporation plc and Global Payments Inc. from 2014 to 2023. Over this decade, Eaton Corporation plc consistently demonstrated robust financial performance, with gross profits peaking at approximately $8.4 billion in 2023, marking a 22% increase from 2014. Meanwhile, Global Payments Inc. showcased a remarkable growth trajectory, with gross profits surging by over 238% during the same period, reaching nearly $5.9 billion in 2023. This stark contrast highlights Global Payments Inc.'s aggressive expansion and strategic positioning in the financial services sector. The data underscores the dynamic nature of these industries and the importance of strategic financial management in achieving sustained growth.