| __timestamp | Caterpillar Inc. | Lockheed Martin Corporation |
|---|---|---|
| Wednesday, January 1, 2014 | 14793000000 | 5374000000 |
| Thursday, January 1, 2015 | 12878000000 | 5302000000 |
| Friday, January 1, 2016 | 9632000000 | 5142000000 |
| Sunday, January 1, 2017 | 13767000000 | 5548000000 |
| Monday, January 1, 2018 | 17003000000 | 7370000000 |
| Tuesday, January 1, 2019 | 16416000000 | 8367000000 |
| Wednesday, January 1, 2020 | 12077000000 | 8654000000 |
| Friday, January 1, 2021 | 15003000000 | 9061000000 |
| Saturday, January 1, 2022 | 17512000000 | 8287000000 |
| Sunday, January 1, 2023 | 23263000000 | 8479000000 |
| Monday, January 1, 2024 | 23324000000 | 6930000000 |
Unlocking the unknown
In the ever-evolving landscape of industrial and defense sectors, Caterpillar Inc. and Lockheed Martin Corporation stand as titans. Over the past decade, Caterpillar's gross profit has shown a remarkable upward trajectory, peaking in 2023 with a 57% increase from its 2016 low. This growth reflects Caterpillar's resilience and adaptability in the face of global economic challenges. Meanwhile, Lockheed Martin has maintained a steady climb, with a notable 76% rise from 2014 to 2021, before experiencing a slight dip in 2024. This trend underscores the company's robust defense contracts and strategic innovations. However, the absence of Caterpillar's 2024 data leaves room for speculation on its future performance. As these industry leaders continue to navigate the complexities of their respective markets, their financial journeys offer valuable insights into the broader economic landscape.
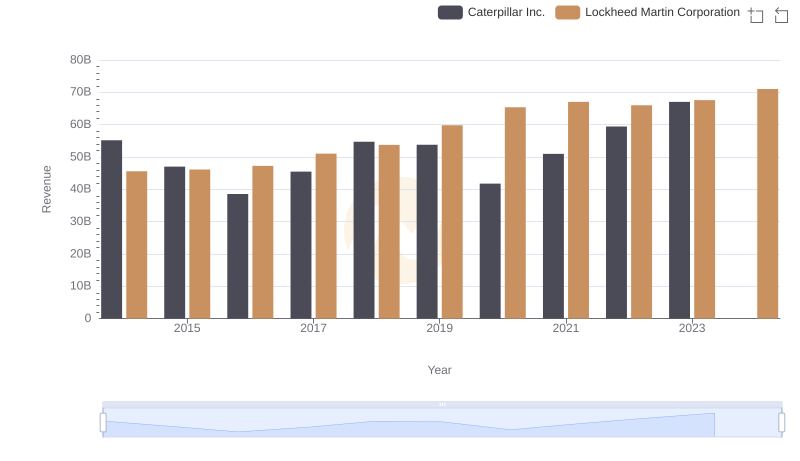
Caterpillar Inc. vs Lockheed Martin Corporation: Examining Key Revenue Metrics
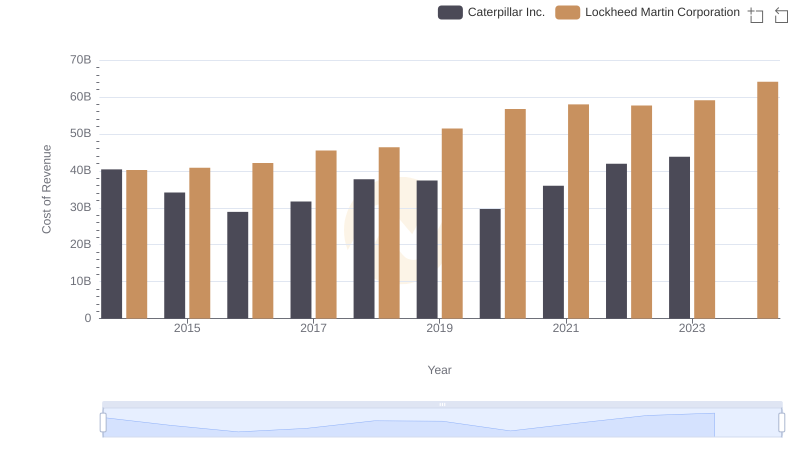
Cost Insights: Breaking Down Caterpillar Inc. and Lockheed Martin Corporation's Expenses

Gross Profit Trends Compared: Caterpillar Inc. vs Honeywell International Inc.

Who Generates Higher Gross Profit? Caterpillar Inc. or Automatic Data Processing, Inc.