| __timestamp | Canadian National Railway Company | W.W. Grainger, Inc. |
|---|---|---|
| Wednesday, January 1, 2014 | 7142000000 | 5650711000 |
| Thursday, January 1, 2015 | 6951000000 | 5741956000 |
| Friday, January 1, 2016 | 6362000000 | 6022647000 |
| Sunday, January 1, 2017 | 7366000000 | 6327301000 |
| Monday, January 1, 2018 | 8359000000 | 6873000000 |
| Tuesday, January 1, 2019 | 8832000000 | 7089000000 |
| Wednesday, January 1, 2020 | 8048000000 | 7559000000 |
| Friday, January 1, 2021 | 8408000000 | 8302000000 |
| Saturday, January 1, 2022 | 9711000000 | 9379000000 |
| Sunday, January 1, 2023 | 9677000000 | 9982000000 |
| Monday, January 1, 2024 | 10410000000 |
In pursuit of knowledge
In the ever-evolving landscape of North American industry, understanding cost structures is crucial. This analysis delves into the cost of revenue trends for Canadian National Railway Company and W.W. Grainger, Inc. over the past decade. From 2014 to 2023, Canadian National Railway's cost of revenue increased by approximately 35%, peaking in 2022. Meanwhile, W.W. Grainger saw a more dramatic rise of about 77%, culminating in 2023. This growth reflects broader economic trends and strategic shifts within each company. Canadian National Railway's steady increase suggests a focus on operational efficiency, while W.W. Grainger's sharper rise may indicate aggressive expansion or increased operational costs. These insights provide a window into the financial health and strategic priorities of two industry giants, offering valuable lessons for investors and business leaders alike.

Canadian National Railway Company vs W.W. Grainger, Inc.: Annual Revenue Growth Compared

Cost of Revenue Trends: Canadian National Railway Company vs Norfolk Southern Corporation

Analyzing Cost of Revenue: Canadian National Railway Company and CSX Corporation

Cost of Revenue Comparison: Canadian National Railway Company vs Roper Technologies, Inc.
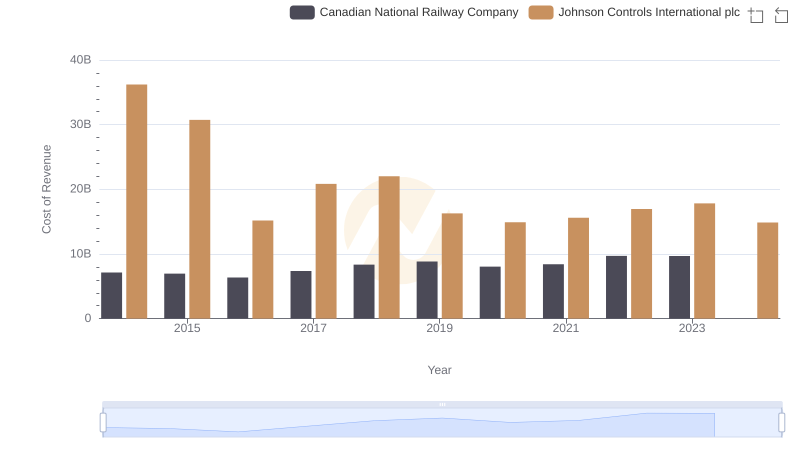
Canadian National Railway Company vs Johnson Controls International plc: Efficiency in Cost of Revenue Explored
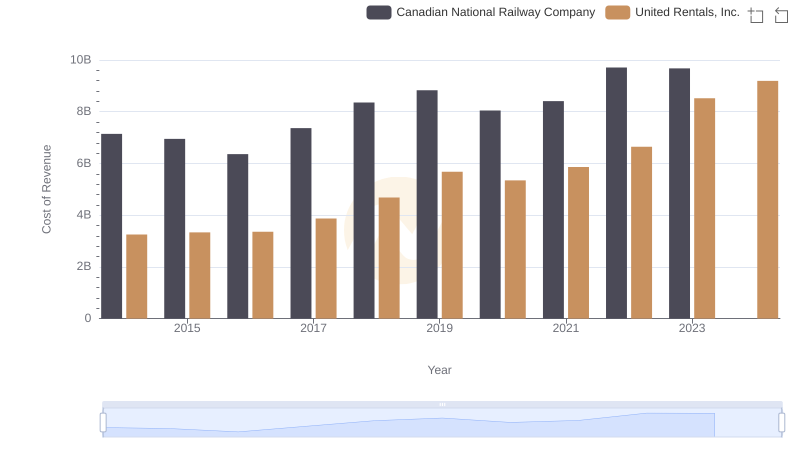
Comparing Cost of Revenue Efficiency: Canadian National Railway Company vs United Rentals, Inc.