| __timestamp | Canadian National Railway Company | Roper Technologies, Inc. |
|---|---|---|
| Wednesday, January 1, 2014 | 7142000000 | 1447595000 |
| Thursday, January 1, 2015 | 6951000000 | 1417749000 |
| Friday, January 1, 2016 | 6362000000 | 1457515000 |
| Sunday, January 1, 2017 | 7366000000 | 1742675000 |
| Monday, January 1, 2018 | 8359000000 | 1911700000 |
| Tuesday, January 1, 2019 | 8832000000 | 1939700000 |
| Wednesday, January 1, 2020 | 8048000000 | 1984100000 |
| Friday, January 1, 2021 | 8408000000 | 1860400000 |
| Saturday, January 1, 2022 | 9711000000 | 1619000000 |
| Sunday, January 1, 2023 | 9677000000 | 1870600000 |
| Monday, January 1, 2024 | 2160900000 |
Unleashing insights
In the ever-evolving landscape of industry giants, Canadian National Railway Company and Roper Technologies, Inc. stand as titans in their respective fields. From 2014 to 2023, these companies have showcased distinct financial trajectories in their cost of revenue. Canadian National Railway, a leader in the transportation sector, has seen its cost of revenue grow by approximately 36%, peaking in 2022. This reflects the company's expansive operations and the increasing demand for freight services across North America. In contrast, Roper Technologies, a diversified technology company, has maintained a more stable cost of revenue, with a modest increase of about 29% over the same period. This stability underscores Roper's strategic focus on high-margin software and technology solutions. As we delve into these financial narratives, the data reveals not just numbers, but the strategic decisions that shape the future of these industry leaders.

Canadian National Railway Company or Roper Technologies, Inc.: Who Leads in Yearly Revenue?

Cost of Revenue Trends: Canadian National Railway Company vs Norfolk Southern Corporation

Analyzing Cost of Revenue: Canadian National Railway Company and CSX Corporation

Cost Insights: Breaking Down Canadian National Railway Company and W.W. Grainger, Inc.'s Expenses
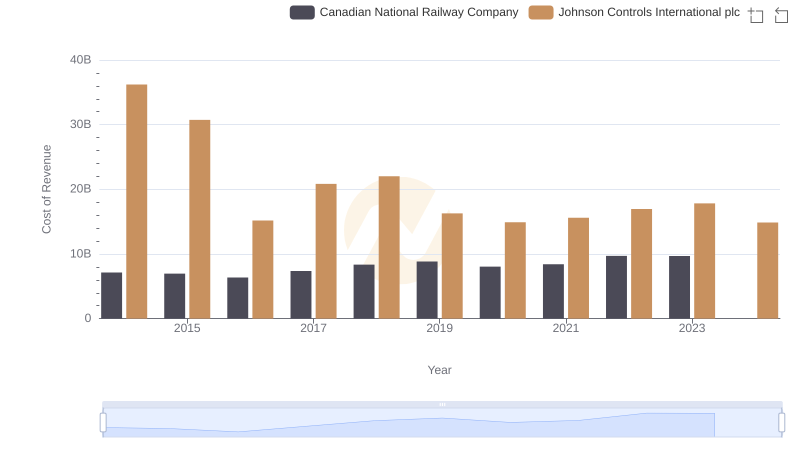
Canadian National Railway Company vs Johnson Controls International plc: Efficiency in Cost of Revenue Explored
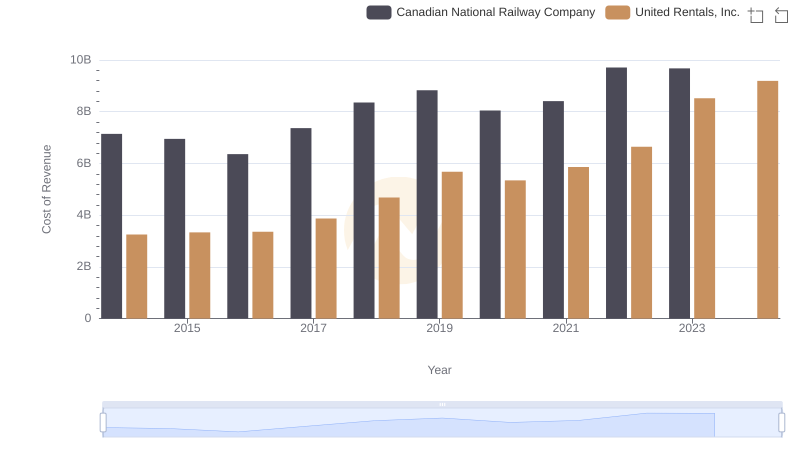
Comparing Cost of Revenue Efficiency: Canadian National Railway Company vs United Rentals, Inc.

A Professional Review of EBITDA: Canadian National Railway Company Compared to Roper Technologies, Inc.