| __timestamp | Canadian National Railway Company | United Rentals, Inc. |
|---|---|---|
| Wednesday, January 1, 2014 | 7142000000 | 3253000000 |
| Thursday, January 1, 2015 | 6951000000 | 3337000000 |
| Friday, January 1, 2016 | 6362000000 | 3359000000 |
| Sunday, January 1, 2017 | 7366000000 | 3872000000 |
| Monday, January 1, 2018 | 8359000000 | 4683000000 |
| Tuesday, January 1, 2019 | 8832000000 | 5681000000 |
| Wednesday, January 1, 2020 | 8048000000 | 5347000000 |
| Friday, January 1, 2021 | 8408000000 | 5863000000 |
| Saturday, January 1, 2022 | 9711000000 | 6646000000 |
| Sunday, January 1, 2023 | 9677000000 | 8519000000 |
| Monday, January 1, 2024 | 9195000000 |
Unleashing insights
In the world of industrial giants, Canadian National Railway Company and United Rentals, Inc. stand as titans of their respective sectors. Over the past decade, these companies have showcased their prowess in managing cost of revenue, a critical metric for operational efficiency. From 2014 to 2023, Canadian National Railway consistently maintained a higher cost of revenue, peaking at approximately $9.7 billion in 2022. In contrast, United Rentals, Inc. demonstrated a remarkable growth trajectory, with its cost of revenue surging by over 160% from 2014 to 2023, reaching around $8.5 billion. This growth reflects United Rentals' aggressive expansion and strategic investments. However, the data for 2024 remains incomplete, leaving room for speculation on future trends. As these industry leaders continue to evolve, their cost management strategies will be pivotal in shaping their competitive edge.

Cost of Revenue Comparison: Canadian National Railway Company vs Roper Technologies, Inc.

Who Generates More Revenue? Canadian National Railway Company or United Rentals, Inc.

Cost Insights: Breaking Down Canadian National Railway Company and W.W. Grainger, Inc.'s Expenses
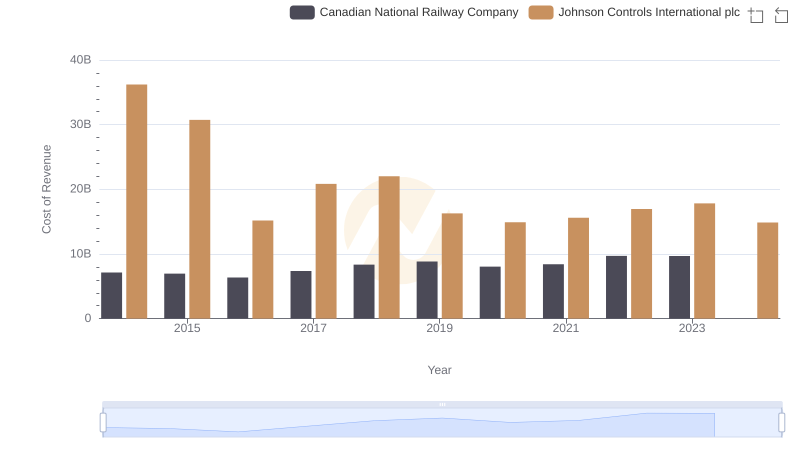
Canadian National Railway Company vs Johnson Controls International plc: Efficiency in Cost of Revenue Explored

Cost of Revenue: Key Insights for Canadian National Railway Company and Axon Enterprise, Inc.
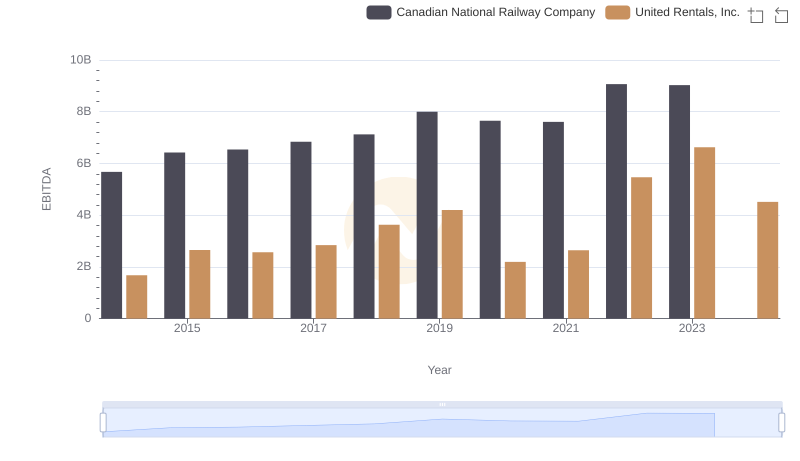
A Professional Review of EBITDA: Canadian National Railway Company Compared to United Rentals, Inc.