| __timestamp | Canadian National Railway Company | W.W. Grainger, Inc. |
|---|---|---|
| Wednesday, January 1, 2014 | 12134000000 | 9964953000 |
| Thursday, January 1, 2015 | 12611000000 | 9973384000 |
| Friday, January 1, 2016 | 12037000000 | 10137204000 |
| Sunday, January 1, 2017 | 13041000000 | 10424858000 |
| Monday, January 1, 2018 | 14321000000 | 11221000000 |
| Tuesday, January 1, 2019 | 14917000000 | 11486000000 |
| Wednesday, January 1, 2020 | 13819000000 | 11797000000 |
| Friday, January 1, 2021 | 14477000000 | 13022000000 |
| Saturday, January 1, 2022 | 17107000000 | 15228000000 |
| Sunday, January 1, 2023 | 16828000000 | 16478000000 |
| Monday, January 1, 2024 | 17168000000 |
Unleashing insights
In the ever-evolving landscape of North American commerce, Canadian National Railway Company (CNR) and W.W. Grainger, Inc. stand as titans in their respective fields. Over the past decade, these companies have demonstrated remarkable resilience and growth. From 2014 to 2023, CNR's revenue surged by approximately 39%, while Grainger's revenue grew by an impressive 65%. This growth reflects their strategic adaptability and market prowess.
CNR's revenue peaked in 2022, reaching a staggering 17.1 billion USD, before slightly declining in 2023. Meanwhile, Grainger's revenue consistently climbed, culminating in a 2023 peak of 16.5 billion USD. These trends highlight the dynamic nature of the transportation and industrial supply sectors, with both companies capitalizing on economic shifts and technological advancements.
As we look to the future, the question remains: which of these industry leaders will continue to outpace the other in the race for revenue growth?

Revenue Insights: Canadian National Railway Company and CSX Corporation Performance Compared
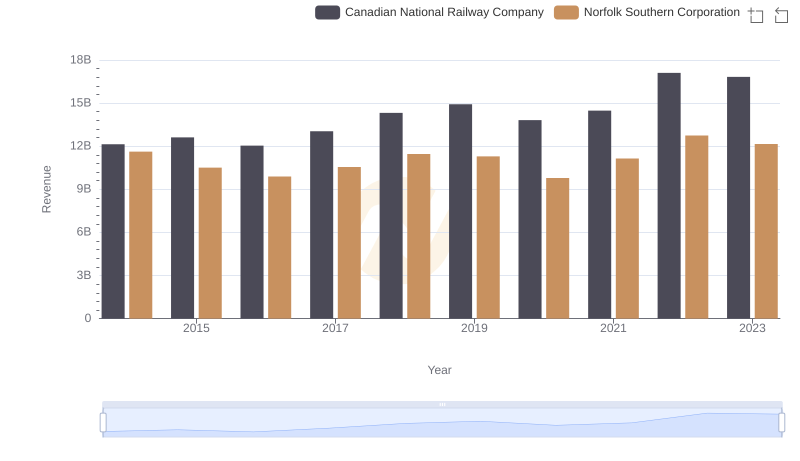
Canadian National Railway Company and Norfolk Southern Corporation: A Comprehensive Revenue Analysis

Canadian National Railway Company vs PACCAR Inc: Examining Key Revenue Metrics

Canadian National Railway Company or Roper Technologies, Inc.: Who Leads in Yearly Revenue?
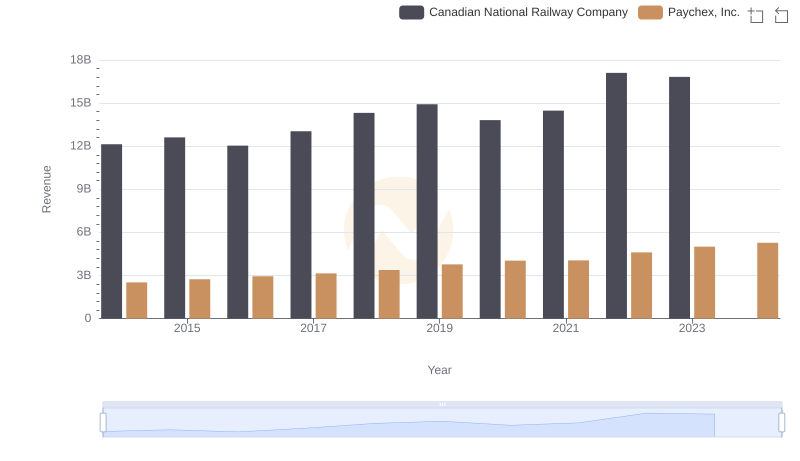
Breaking Down Revenue Trends: Canadian National Railway Company vs Paychex, Inc.

Revenue Insights: Canadian National Railway Company and Johnson Controls International plc Performance Compared

Who Generates More Revenue? Canadian National Railway Company or United Rentals, Inc.
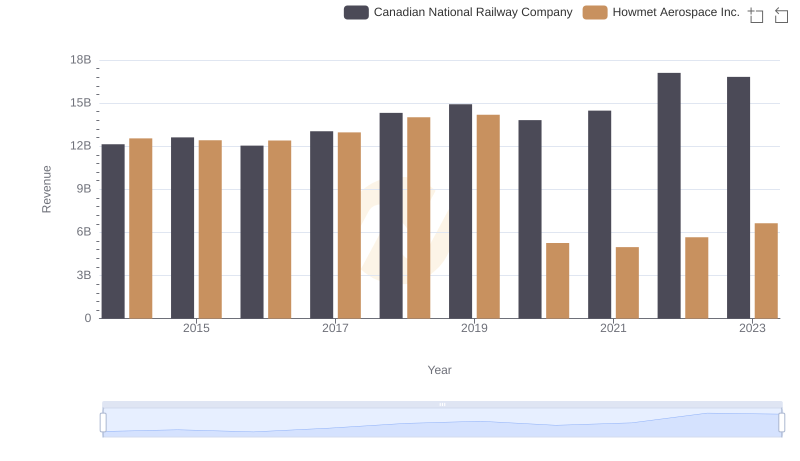
Canadian National Railway Company and Howmet Aerospace Inc.: A Comprehensive Revenue Analysis

Cost Insights: Breaking Down Canadian National Railway Company and W.W. Grainger, Inc.'s Expenses
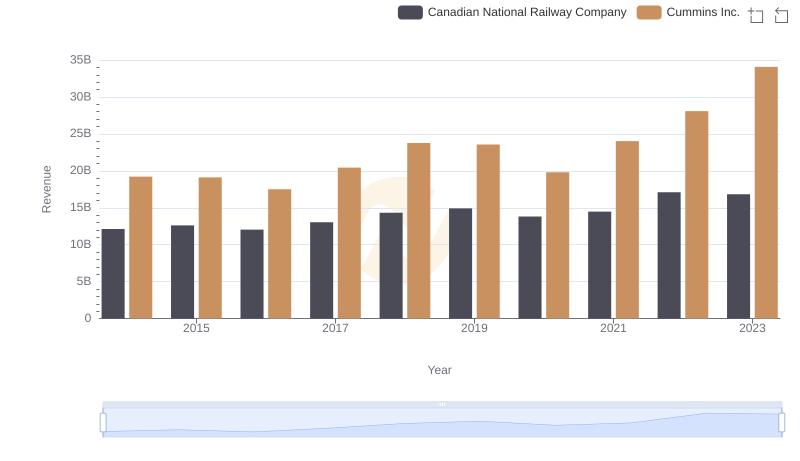
Revenue Showdown: Canadian National Railway Company vs Cummins Inc.