| __timestamp | Canadian National Railway Company | Old Dominion Freight Line, Inc. |
|---|---|---|
| Wednesday, January 1, 2014 | 7142000000 | 2100409000 |
| Thursday, January 1, 2015 | 6951000000 | 2214943000 |
| Friday, January 1, 2016 | 6362000000 | 2246890000 |
| Sunday, January 1, 2017 | 7366000000 | 2482732000 |
| Monday, January 1, 2018 | 8359000000 | 2899452000 |
| Tuesday, January 1, 2019 | 8832000000 | 2938895000 |
| Wednesday, January 1, 2020 | 8048000000 | 2786531000 |
| Friday, January 1, 2021 | 8408000000 | 3481268000 |
| Saturday, January 1, 2022 | 9711000000 | 4003951000 |
| Sunday, January 1, 2023 | 9677000000 | 3793953000 |
Unlocking the unknown
In the ever-evolving landscape of transportation and logistics, understanding cost structures is crucial. Over the past decade, Canadian National Railway Company and Old Dominion Freight Line, Inc. have demonstrated distinct financial trajectories. From 2014 to 2023, Canadian National Railway's cost of revenue increased by approximately 35%, peaking in 2022. Meanwhile, Old Dominion Freight Line saw a remarkable 90% rise, reflecting its aggressive expansion and operational efficiency.
These insights offer a window into the strategic decisions shaping the future of these industry giants.

Canadian National Railway Company and Old Dominion Freight Line, Inc.: A Comprehensive Revenue Analysis
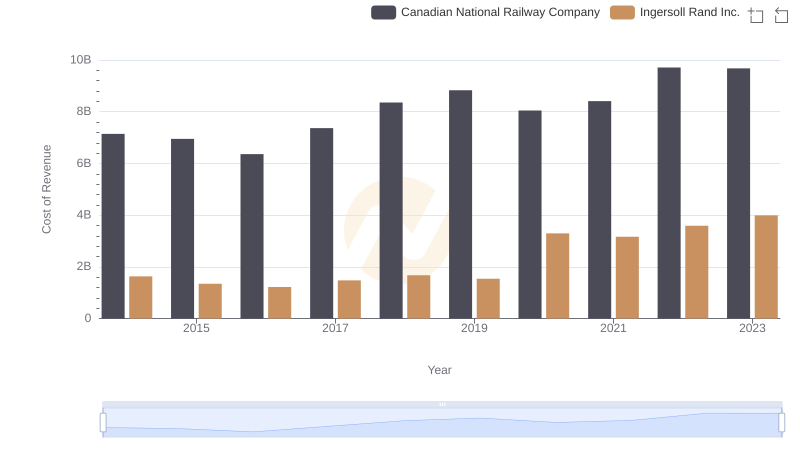
Analyzing Cost of Revenue: Canadian National Railway Company and Ingersoll Rand Inc.

Cost of Revenue Trends: Canadian National Railway Company vs Verisk Analytics, Inc.
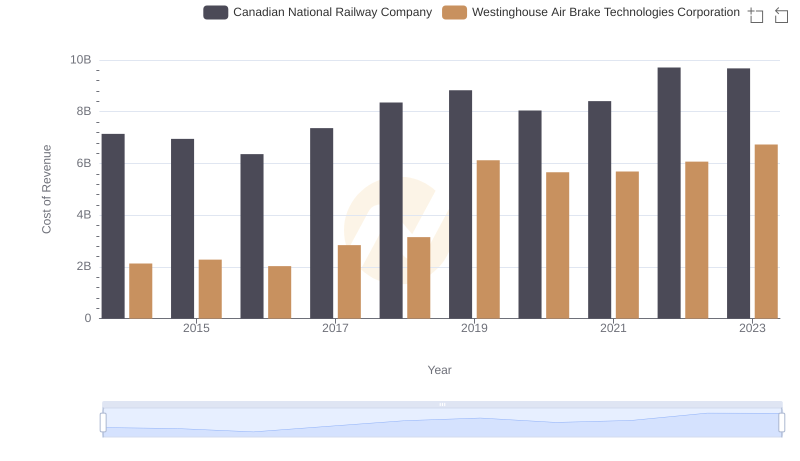
Cost of Revenue Comparison: Canadian National Railway Company vs Westinghouse Air Brake Technologies Corporation
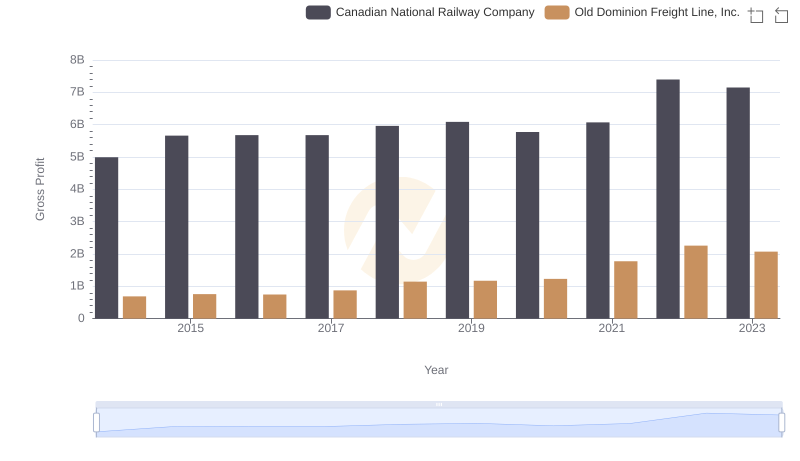
Key Insights on Gross Profit: Canadian National Railway Company vs Old Dominion Freight Line, Inc.

Comparative EBITDA Analysis: Canadian National Railway Company vs Old Dominion Freight Line, Inc.