| __timestamp | Canadian National Railway Company | Ingersoll Rand Inc. |
|---|---|---|
| Wednesday, January 1, 2014 | 7142000000 | 1633224000 |
| Thursday, January 1, 2015 | 6951000000 | 1347800000 |
| Friday, January 1, 2016 | 6362000000 | 1222705000 |
| Sunday, January 1, 2017 | 7366000000 | 1477500000 |
| Monday, January 1, 2018 | 8359000000 | 1677300000 |
| Tuesday, January 1, 2019 | 8832000000 | 1540200000 |
| Wednesday, January 1, 2020 | 8048000000 | 3296800000 |
| Friday, January 1, 2021 | 8408000000 | 3163900000 |
| Saturday, January 1, 2022 | 9711000000 | 3590700000 |
| Sunday, January 1, 2023 | 9677000000 | 3993900000 |
| Monday, January 1, 2024 | 0 |
Unveiling the hidden dimensions of data
In the ever-evolving landscape of North American industry, Canadian National Railway Company and Ingersoll Rand Inc. stand as titans in their respective fields. From 2014 to 2023, these companies have showcased distinct trajectories in their cost of revenue, reflecting broader economic trends and strategic shifts.
Canadian National Railway Company, a leader in rail transportation, has seen its cost of revenue grow by approximately 36% over the decade, peaking in 2022. This growth underscores the increasing demand for efficient logistics and transportation solutions across North America.
In contrast, Ingersoll Rand Inc., a powerhouse in industrial manufacturing, experienced a dramatic surge in 2020, with costs nearly doubling from the previous year. This spike aligns with the global industrial rebound post-pandemic, highlighting the company's pivotal role in supporting infrastructure and manufacturing sectors.
These insights offer a window into the dynamic interplay of industry forces shaping the future of these iconic companies.

Cost of Revenue: Key Insights for Canadian National Railway Company and Quanta Services, Inc.
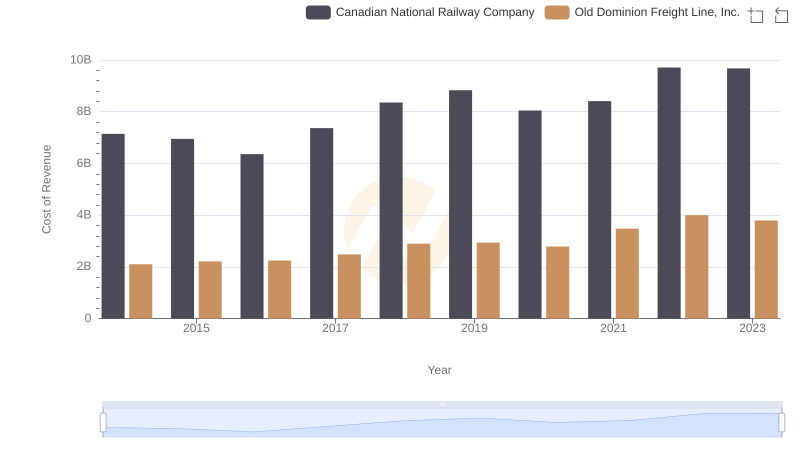
Cost Insights: Breaking Down Canadian National Railway Company and Old Dominion Freight Line, Inc.'s Expenses

Cost of Revenue Trends: Canadian National Railway Company vs Verisk Analytics, Inc.
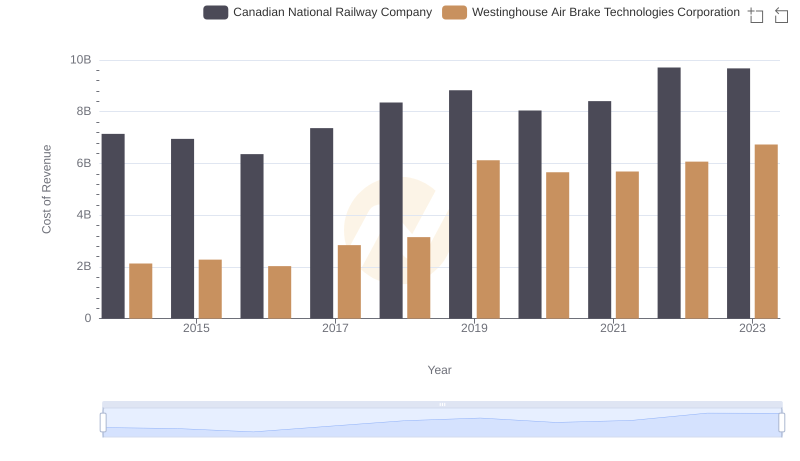
Cost of Revenue Comparison: Canadian National Railway Company vs Westinghouse Air Brake Technologies Corporation

Key Insights on Gross Profit: Canadian National Railway Company vs Ingersoll Rand Inc.