| __timestamp | Allegion plc | Ryanair Holdings plc |
|---|---|---|
| Wednesday, January 1, 2014 | 2118300000 | 5036700000 |
| Thursday, January 1, 2015 | 2068100000 | 5654000000 |
| Friday, January 1, 2016 | 2238000000 | 6535800000 |
| Sunday, January 1, 2017 | 2408200000 | 6647800000 |
| Monday, January 1, 2018 | 2731700000 | 7151000000 |
| Tuesday, January 1, 2019 | 2854000000 | 7697400000 |
| Wednesday, January 1, 2020 | 2719900000 | 8494799999 |
| Friday, January 1, 2021 | 2867400000 | 1635800000 |
| Saturday, January 1, 2022 | 3271900000 | 4800900000 |
| Sunday, January 1, 2023 | 3650800000 | 10775200000 |
| Monday, January 1, 2024 | 3772200000 | 13443800000 |
Unleashing insights
In the ever-evolving landscape of global business, Ryanair Holdings plc and Allegion plc stand as intriguing case studies of revenue growth over the past decade. From 2014 to 2023, Ryanair's revenue soared by approximately 114%, peaking in 2023 with a remarkable 10.8 billion. This growth trajectory underscores Ryanair's resilience and strategic prowess in the competitive airline industry.
Conversely, Allegion plc, a leader in security solutions, demonstrated steady growth, with revenues increasing by about 72% over the same period. By 2023, Allegion's revenue reached 3.7 billion, reflecting its robust market position. Notably, 2021 marked a challenging year for Ryanair, with revenues plummeting to 1.6 billion, a stark contrast to its usual performance.
This comparative analysis highlights the dynamic nature of business growth and the diverse strategies employed by companies to navigate economic landscapes.
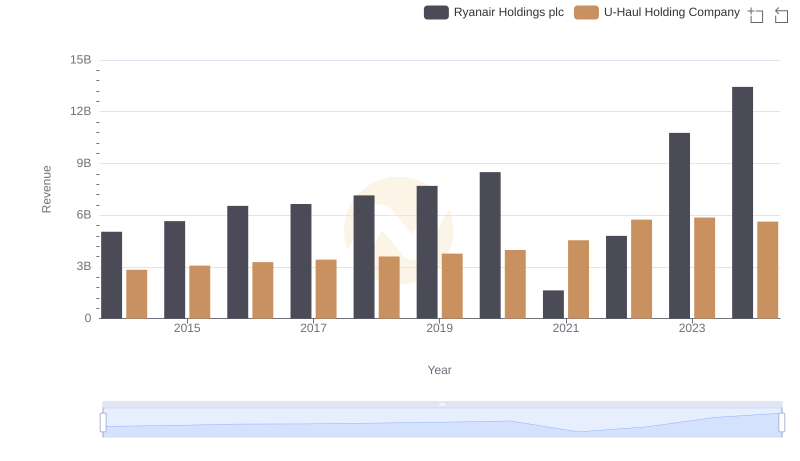
Breaking Down Revenue Trends: Ryanair Holdings plc vs U-Haul Holding Company
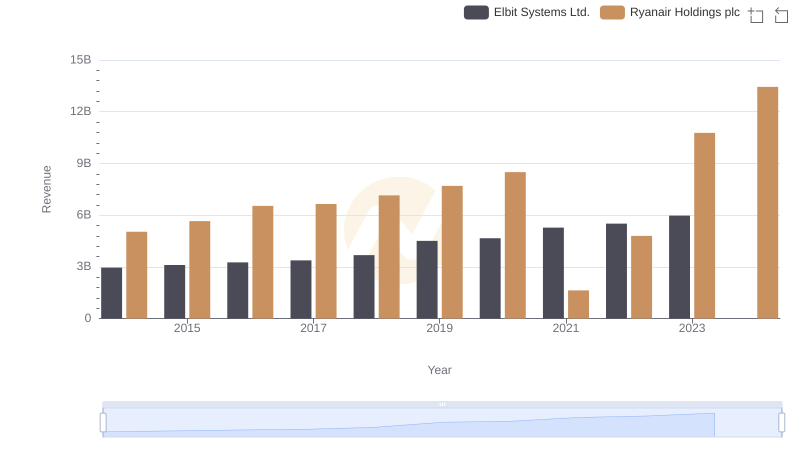
Who Generates More Revenue? Ryanair Holdings plc or Elbit Systems Ltd.
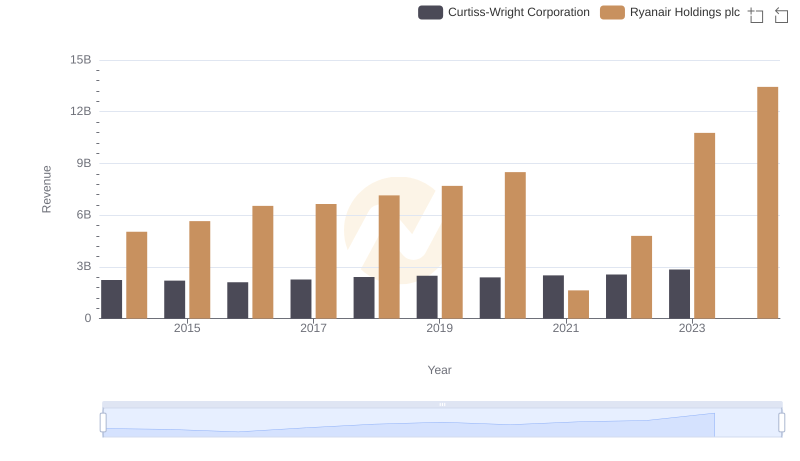
Ryanair Holdings plc vs Curtiss-Wright Corporation: Examining Key Revenue Metrics
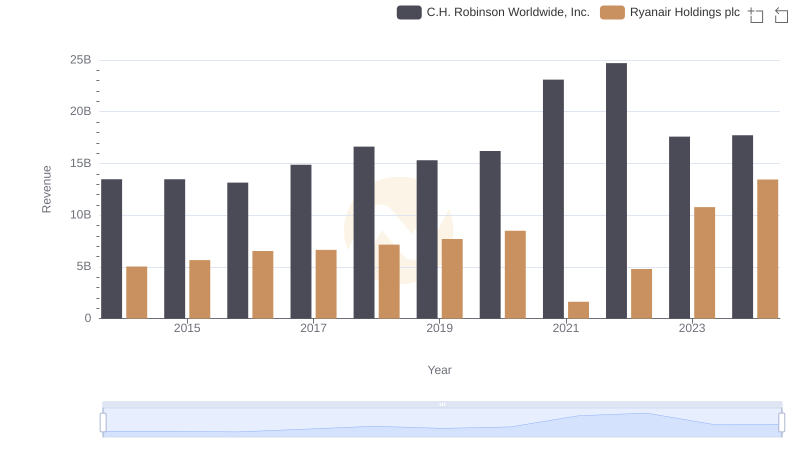
Ryanair Holdings plc vs C.H. Robinson Worldwide, Inc.: Examining Key Revenue Metrics
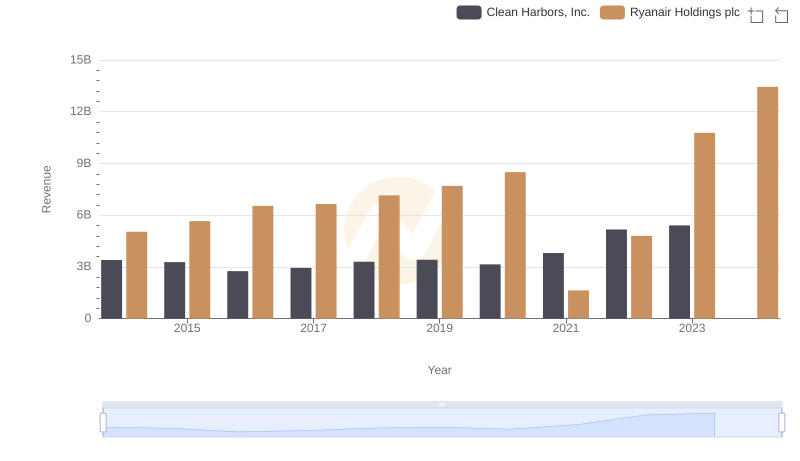
Revenue Showdown: Ryanair Holdings plc vs Clean Harbors, Inc.
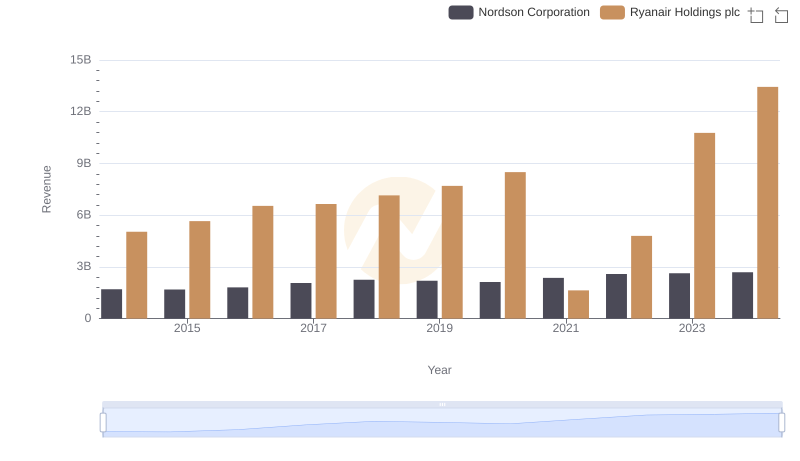
Annual Revenue Comparison: Ryanair Holdings plc vs Nordson Corporation
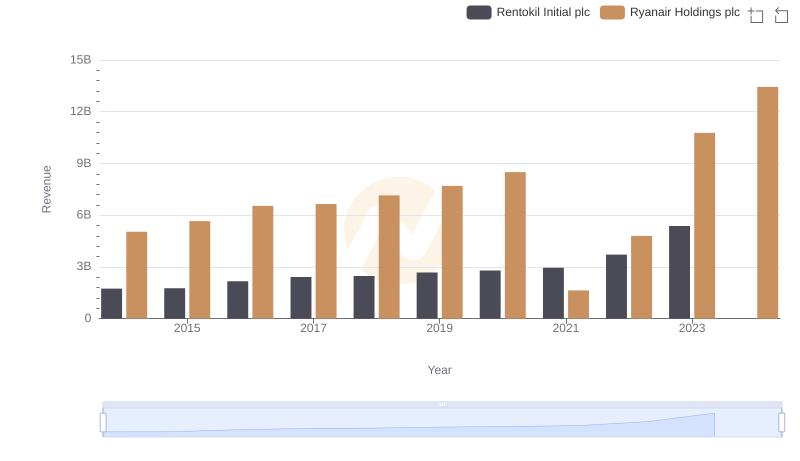
Annual Revenue Comparison: Ryanair Holdings plc vs Rentokil Initial plc
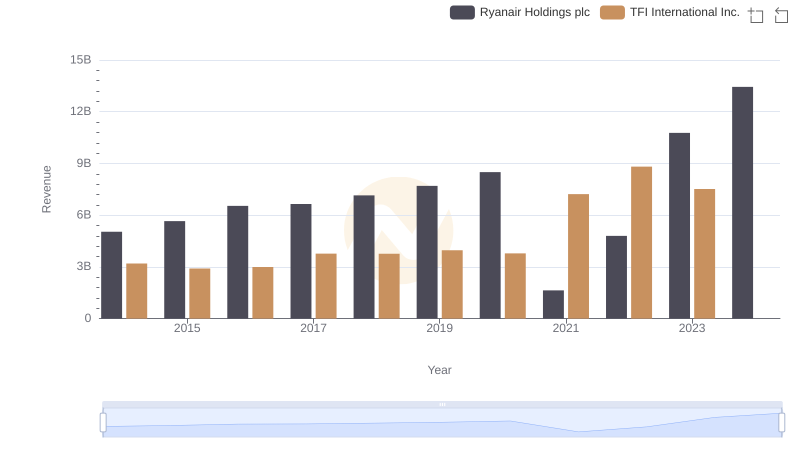
Comparing Revenue Performance: Ryanair Holdings plc or TFI International Inc.?
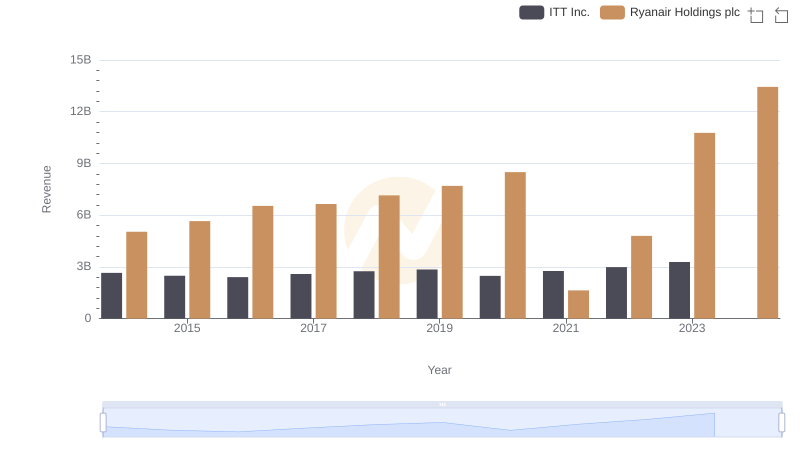
Who Generates More Revenue? Ryanair Holdings plc or ITT Inc.
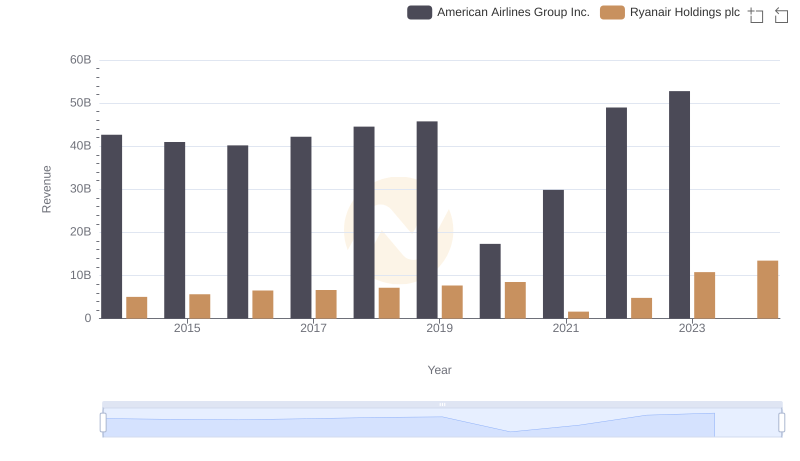
Comparing Revenue Performance: Ryanair Holdings plc or American Airlines Group Inc.?
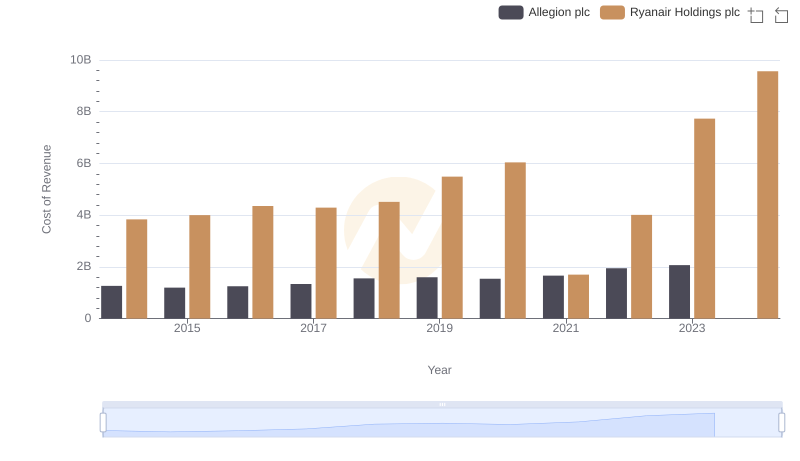
Cost Insights: Breaking Down Ryanair Holdings plc and Allegion plc's Expenses
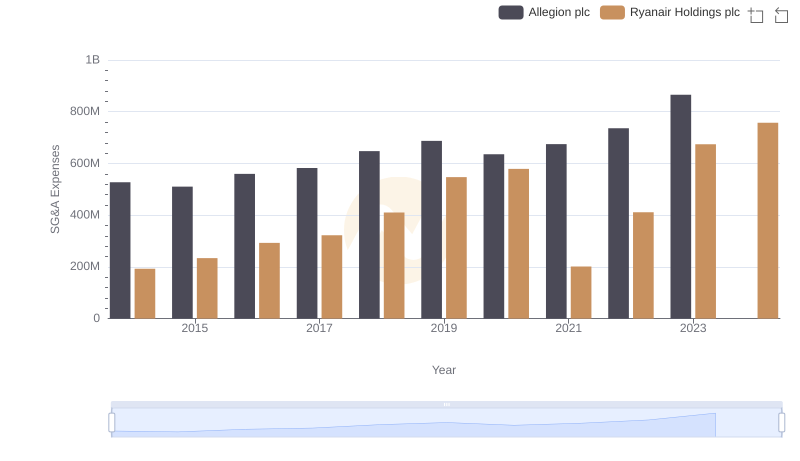
Who Optimizes SG&A Costs Better? Ryanair Holdings plc or Allegion plc