| __timestamp | American Airlines Group Inc. | Eaton Corporation plc |
|---|---|---|
| Wednesday, January 1, 2014 | 42650000000 | 22552000000 |
| Thursday, January 1, 2015 | 40990000000 | 20855000000 |
| Friday, January 1, 2016 | 40180000000 | 19747000000 |
| Sunday, January 1, 2017 | 42207000000 | 20404000000 |
| Monday, January 1, 2018 | 44541000000 | 21609000000 |
| Tuesday, January 1, 2019 | 45768000000 | 21390000000 |
| Wednesday, January 1, 2020 | 17337000000 | 17858000000 |
| Friday, January 1, 2021 | 29882000000 | 19628000000 |
| Saturday, January 1, 2022 | 48971000000 | 20752000000 |
| Sunday, January 1, 2023 | 52788000000 | 23196000000 |
| Monday, January 1, 2024 | 24878000000 |
Unlocking the unknown
In the ever-evolving landscape of corporate revenue, Eaton Corporation plc and American Airlines Group Inc. stand as titans in their respective industries. From 2014 to 2023, these companies have showcased contrasting revenue trajectories, reflecting broader economic trends and sector-specific challenges.
American Airlines, a leader in the aviation sector, experienced a dramatic dip in 2020, with revenues plummeting by nearly 60% due to the global pandemic. However, the airline rebounded impressively, achieving a 204% increase by 2023, underscoring the resilience of the travel industry.
Conversely, Eaton Corporation, a powerhouse in the industrial sector, maintained a steady growth trajectory. Despite a slight dip in 2020, Eaton's revenue grew by approximately 30% over the decade, highlighting its robust business model and adaptability.
This comparison not only illustrates the impact of external factors on revenue but also the strategic responses of these industry leaders.
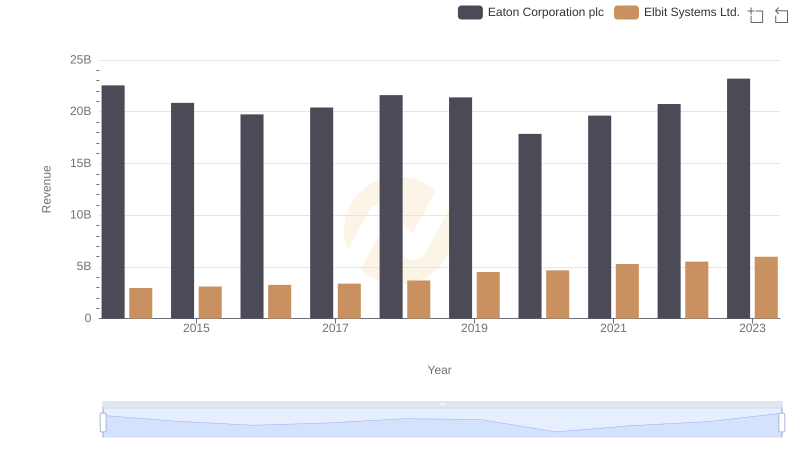
Eaton Corporation plc vs Elbit Systems Ltd.: Examining Key Revenue Metrics
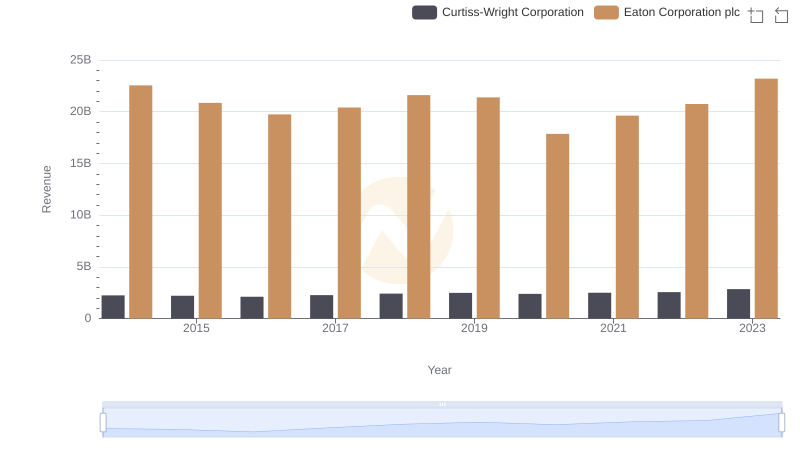
Eaton Corporation plc and Curtiss-Wright Corporation: A Comprehensive Revenue Analysis
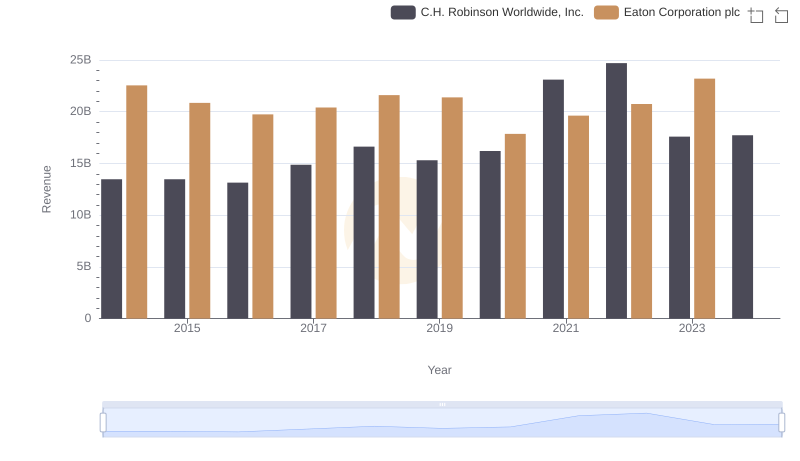
Breaking Down Revenue Trends: Eaton Corporation plc vs C.H. Robinson Worldwide, Inc.
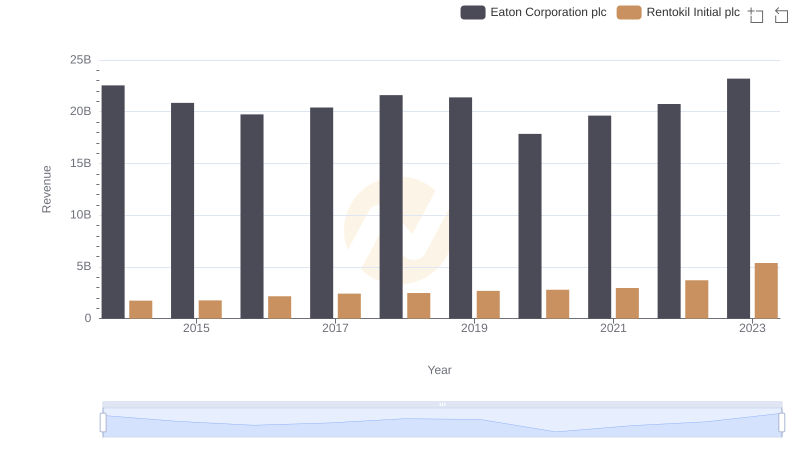
Eaton Corporation plc vs Rentokil Initial plc: Examining Key Revenue Metrics
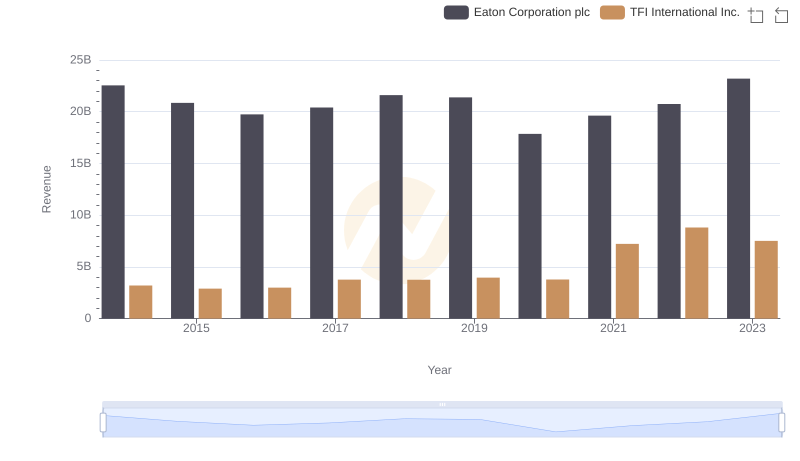
Eaton Corporation plc or TFI International Inc.: Who Leads in Yearly Revenue?
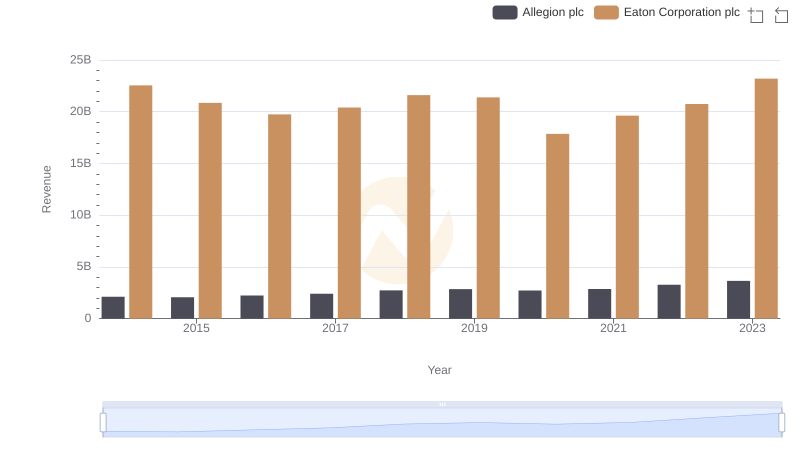
Breaking Down Revenue Trends: Eaton Corporation plc vs Allegion plc