| __timestamp | 3M Company | Howmet Aerospace Inc. |
|---|---|---|
| Wednesday, January 1, 2014 | 31821000000 | 12542000000 |
| Thursday, January 1, 2015 | 30274000000 | 12413000000 |
| Friday, January 1, 2016 | 30109000000 | 12394000000 |
| Sunday, January 1, 2017 | 31657000000 | 12960000000 |
| Monday, January 1, 2018 | 32765000000 | 14014000000 |
| Tuesday, January 1, 2019 | 32136000000 | 14192000000 |
| Wednesday, January 1, 2020 | 32184000000 | 5259000000 |
| Friday, January 1, 2021 | 35355000000 | 4972000000 |
| Saturday, January 1, 2022 | 34229000000 | 5663000000 |
| Sunday, January 1, 2023 | 32681000000 | 6640000000 |
| Monday, January 1, 2024 | 24575000000 | 7430000000 |
Unveiling the hidden dimensions of data
In the ever-evolving landscape of industrial giants, 3M Company and Howmet Aerospace Inc. have carved distinct paths over the past decade. From 2014 to 2023, 3M consistently showcased its prowess, with revenues peaking in 2021 at approximately 35.4 billion USD, marking a 10% increase from 2014. However, 2024 saw a significant dip, with revenues dropping to around 24.6 billion USD, indicating potential challenges or strategic shifts.
Conversely, Howmet Aerospace experienced a rollercoaster journey. While 2018 and 2019 were high points, with revenues nearing 14 billion USD, the subsequent years saw a sharp decline, particularly in 2020 and 2021, with revenues plummeting by over 60%. This stark contrast highlights the dynamic nature of the aerospace sector, influenced by global events and market demands.
As we look to the future, the resilience and adaptability of these companies will be pivotal in navigating the complexities of the global market.
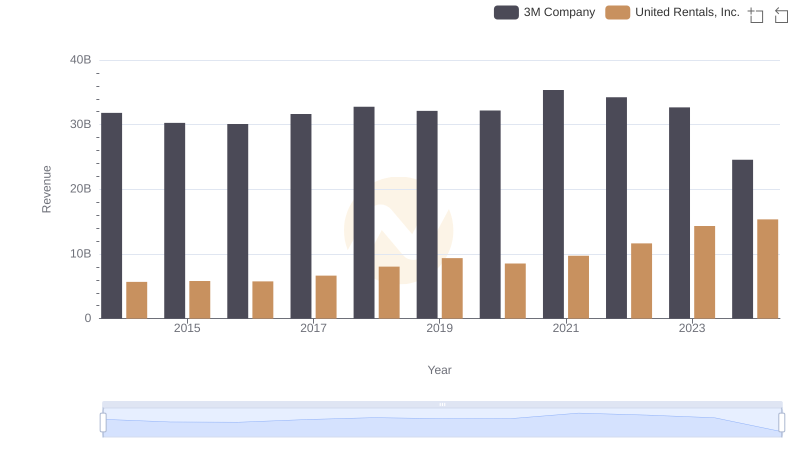
Who Generates More Revenue? 3M Company or United Rentals, Inc.
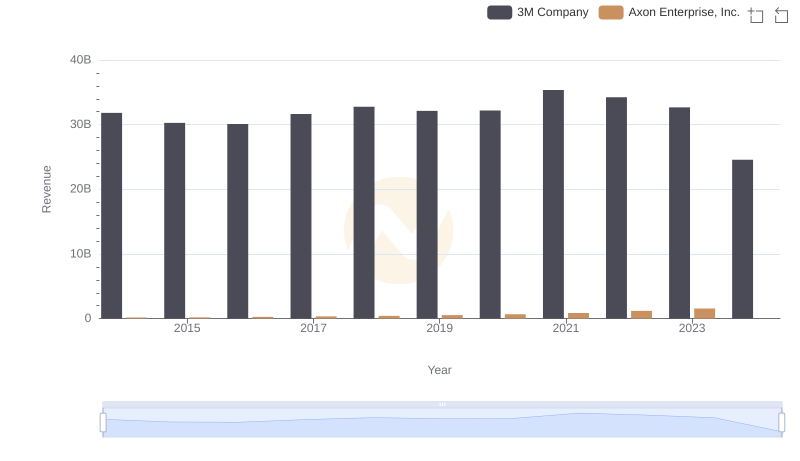
Revenue Showdown: 3M Company vs Axon Enterprise, Inc.
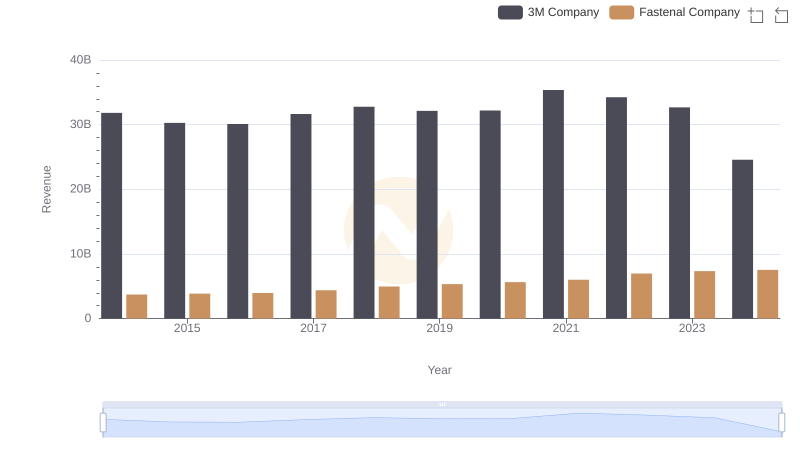
3M Company or Fastenal Company: Who Leads in Yearly Revenue?
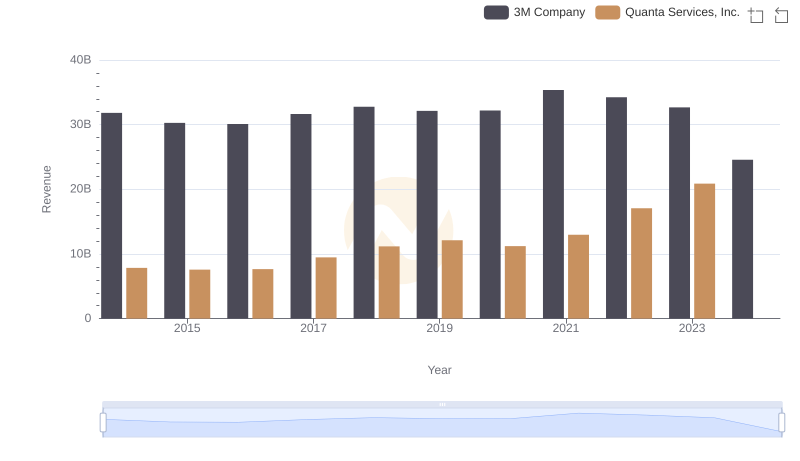
Comparing Revenue Performance: 3M Company or Quanta Services, Inc.?
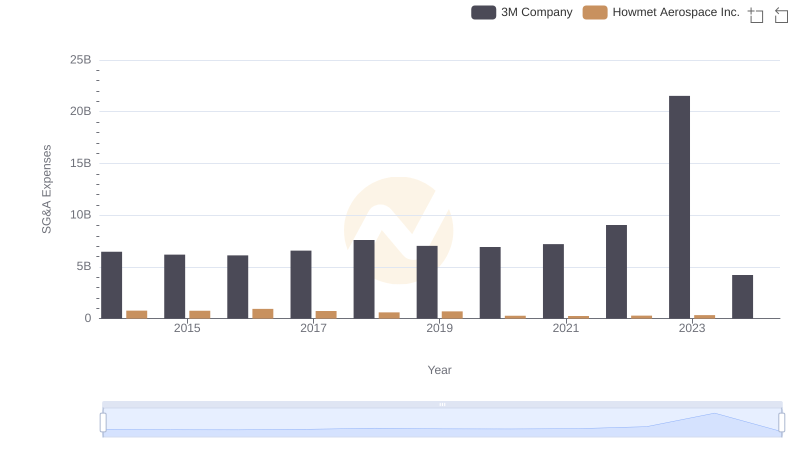
Who Optimizes SG&A Costs Better? 3M Company or Howmet Aerospace Inc.