| __timestamp | 3M Company | CSX Corporation |
|---|---|---|
| Wednesday, January 1, 2014 | 31821000000 | 12669000000 |
| Thursday, January 1, 2015 | 30274000000 | 11811000000 |
| Friday, January 1, 2016 | 30109000000 | 11069000000 |
| Sunday, January 1, 2017 | 31657000000 | 11408000000 |
| Monday, January 1, 2018 | 32765000000 | 12250000000 |
| Tuesday, January 1, 2019 | 32136000000 | 11937000000 |
| Wednesday, January 1, 2020 | 32184000000 | 10583000000 |
| Friday, January 1, 2021 | 35355000000 | 12522000000 |
| Saturday, January 1, 2022 | 34229000000 | 14853000000 |
| Sunday, January 1, 2023 | 32681000000 | 14657000000 |
| Monday, January 1, 2024 | 24575000000 |
Unveiling the hidden dimensions of data
In the ever-evolving landscape of American industry, 3M Company and CSX Corporation stand as titans in their respective fields. From 2014 to 2023, these companies have showcased distinct revenue trajectories, reflecting broader economic trends and sector-specific challenges.
3M, a diversified technology company, experienced a revenue peak in 2021, with a notable 11% increase from the previous year. However, by 2023, its revenue saw a decline of approximately 8%, highlighting potential market shifts or internal restructuring.
Conversely, CSX Corporation, a leader in rail-based freight transportation, demonstrated a steady climb, achieving a remarkable 40% growth from 2016 to 2022. This growth underscores the resilience of the transportation sector amidst global supply chain disruptions.
While 2024 data for CSX remains elusive, these trends offer a compelling snapshot of industrial dynamics over the past decade.
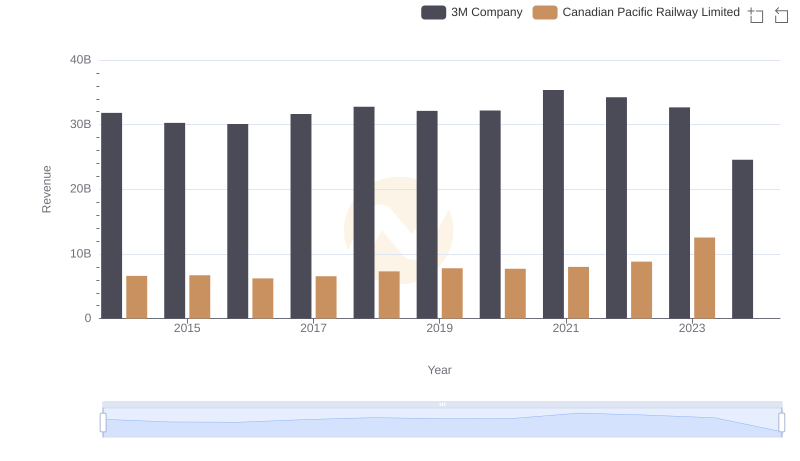
3M Company and Canadian Pacific Railway Limited: A Comprehensive Revenue Analysis
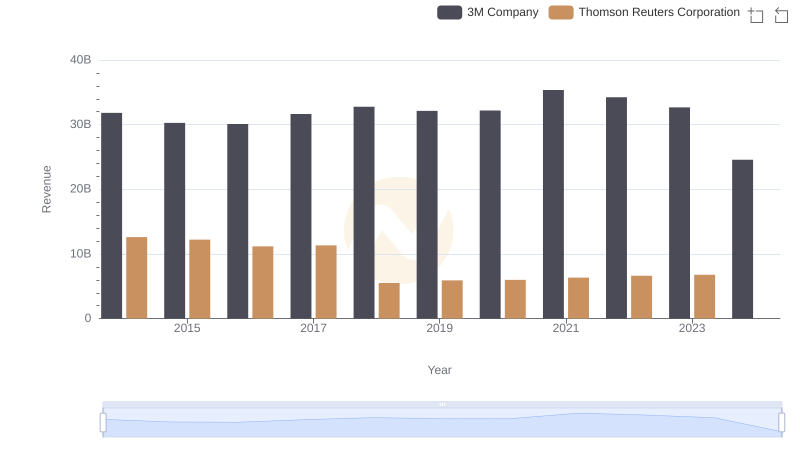
Revenue Insights: 3M Company and Thomson Reuters Corporation Performance Compared

Comparing Revenue Performance: 3M Company or Northrop Grumman Corporation?
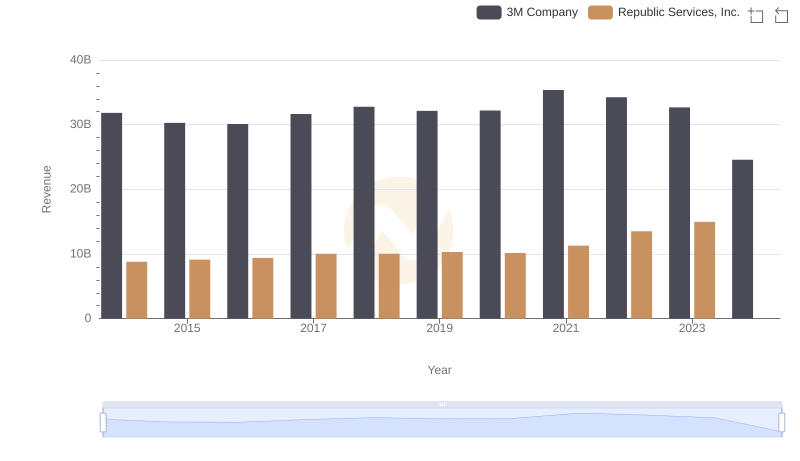
Annual Revenue Comparison: 3M Company vs Republic Services, Inc.

Revenue Showdown: 3M Company vs Canadian National Railway Company
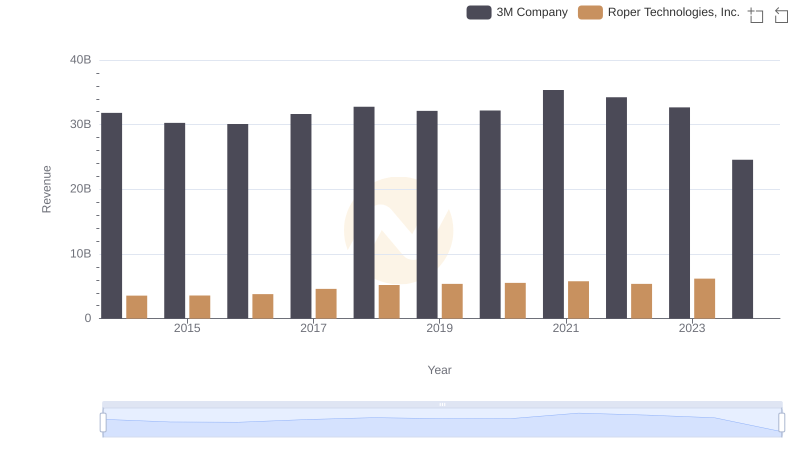
Comparing Revenue Performance: 3M Company or Roper Technologies, Inc.?