| __timestamp | 3M Company | Thomson Reuters Corporation |
|---|---|---|
| Wednesday, January 1, 2014 | 31821000000 | 12607000000 |
| Thursday, January 1, 2015 | 30274000000 | 12209000000 |
| Friday, January 1, 2016 | 30109000000 | 11166000000 |
| Sunday, January 1, 2017 | 31657000000 | 11333000000 |
| Monday, January 1, 2018 | 32765000000 | 5501000000 |
| Tuesday, January 1, 2019 | 32136000000 | 5906000000 |
| Wednesday, January 1, 2020 | 32184000000 | 5984000000 |
| Friday, January 1, 2021 | 35355000000 | 6348000000 |
| Saturday, January 1, 2022 | 34229000000 | 6627000000 |
| Sunday, January 1, 2023 | 32681000000 | 6794000000 |
| Monday, January 1, 2024 | 24575000000 |
Cracking the code
Over the past decade, the financial trajectories of 3M Company and Thomson Reuters Corporation have showcased intriguing patterns. From 2014 to 2023, 3M Company consistently outperformed Thomson Reuters in terms of revenue, with 3M's revenue peaking in 2021 at approximately 35.4 billion USD, marking a 12% increase from 2014. In contrast, Thomson Reuters experienced a significant dip in 2018, with revenues dropping by over 50% compared to the previous year. However, they have shown resilience, gradually recovering to reach around 6.8 billion USD by 2023.
While 3M's revenue trend shows a slight decline post-2021, Thomson Reuters' steady recovery highlights their adaptive strategies in a competitive market. Notably, data for 2024 is incomplete, indicating potential shifts in the coming years. This analysis underscores the dynamic nature of corporate financial landscapes.
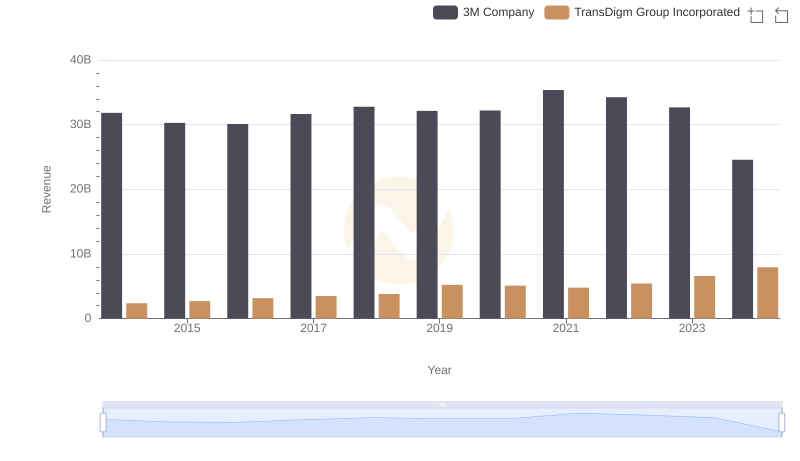
Who Generates More Revenue? 3M Company or TransDigm Group Incorporated
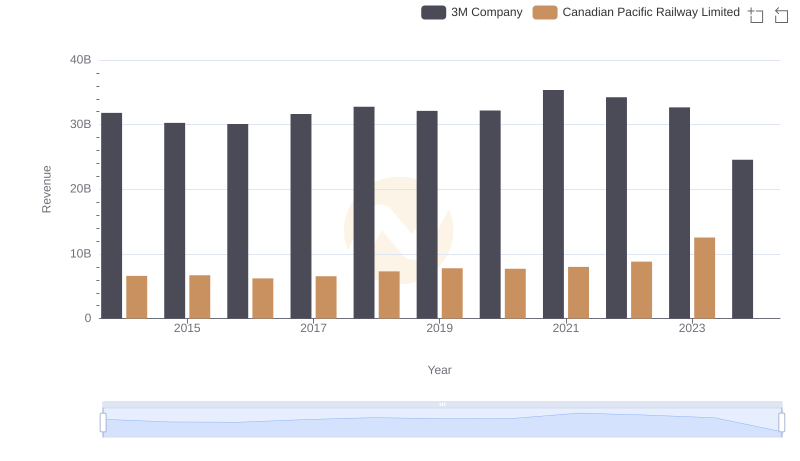
3M Company and Canadian Pacific Railway Limited: A Comprehensive Revenue Analysis

Comparing Revenue Performance: 3M Company or Northrop Grumman Corporation?
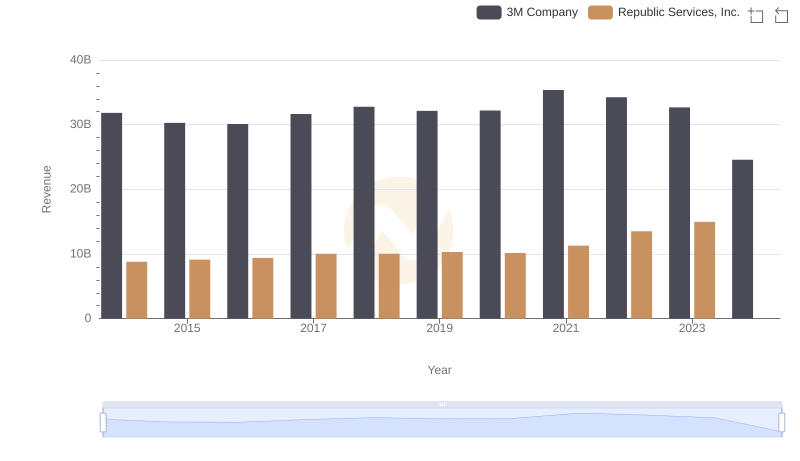
Annual Revenue Comparison: 3M Company vs Republic Services, Inc.

Revenue Showdown: 3M Company vs Canadian National Railway Company
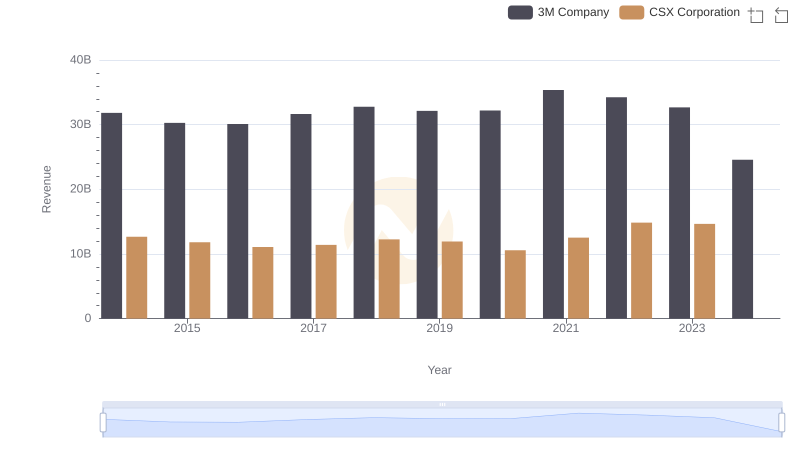
3M Company vs CSX Corporation: Annual Revenue Growth Compared
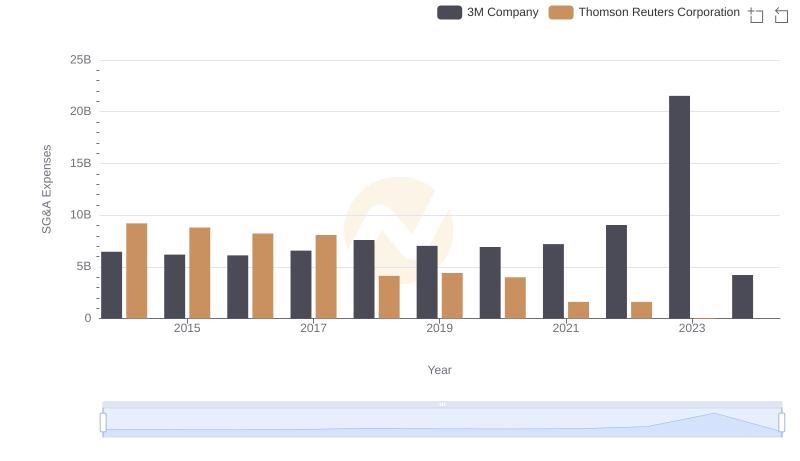
3M Company or Thomson Reuters Corporation: Who Manages SG&A Costs Better?