| __timestamp | Watsco, Inc. | ZTO Express (Cayman) Inc. |
|---|---|---|
| Wednesday, January 1, 2014 | 2988138000 | 2770530000 |
| Thursday, January 1, 2015 | 3105882000 | 3998737000 |
| Friday, January 1, 2016 | 3186118000 | 6345899000 |
| Sunday, January 1, 2017 | 3276296000 | 8714489000 |
| Monday, January 1, 2018 | 3426401000 | 12239568000 |
| Tuesday, January 1, 2019 | 3613406000 | 15488778000 |
| Wednesday, January 1, 2020 | 3832107000 | 19377184000 |
| Friday, January 1, 2021 | 4612647000 | 23816462000 |
| Saturday, January 1, 2022 | 5244055000 | 26337721000 |
| Sunday, January 1, 2023 | 5291627000 | 26756389000 |
| Monday, January 1, 2024 | 5573604000 |
Unleashing the power of data
In the ever-evolving landscape of global commerce, understanding cost efficiency is paramount. This analysis delves into the cost of revenue trends for Watsco, Inc. and ZTO Express (Cayman) Inc. from 2014 to 2023. Over this period, ZTO Express has seen a staggering increase in its cost of revenue, growing by approximately 866%, while Watsco's costs rose by about 77%. This stark contrast highlights ZTO's rapid expansion in the logistics sector, particularly in China, where e-commerce has boomed. Meanwhile, Watsco, a leader in HVAC distribution, has maintained steady growth, reflecting its stable market position in North America. The data underscores the differing strategies and market dynamics faced by these companies, offering a fascinating glimpse into their operational efficiencies.
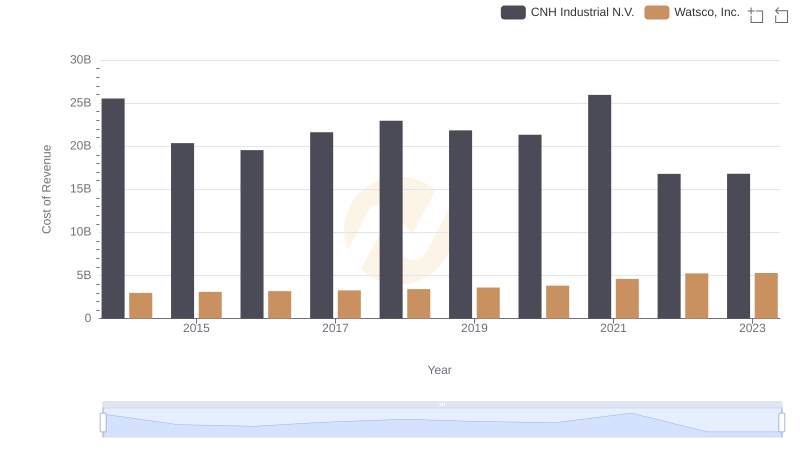
Watsco, Inc. vs CNH Industrial N.V.: Efficiency in Cost of Revenue Explored
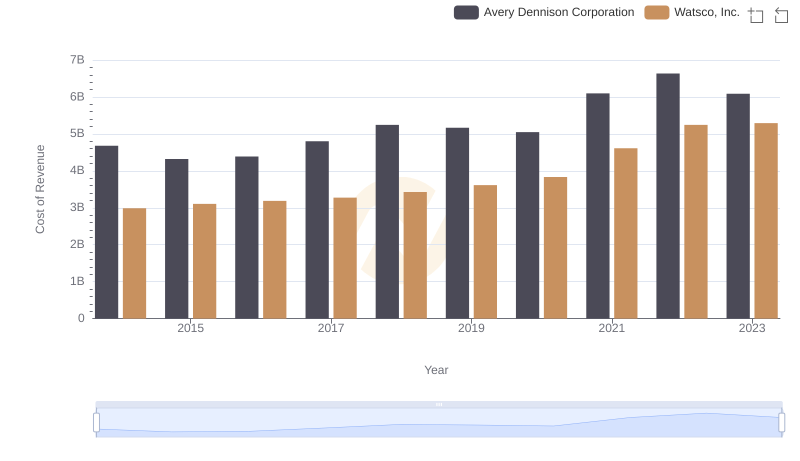
Cost of Revenue Comparison: Watsco, Inc. vs Avery Dennison Corporation
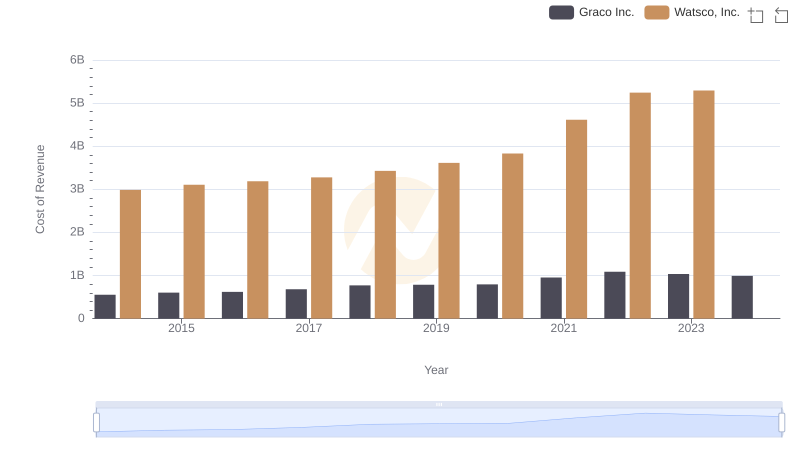
Analyzing Cost of Revenue: Watsco, Inc. and Graco Inc.
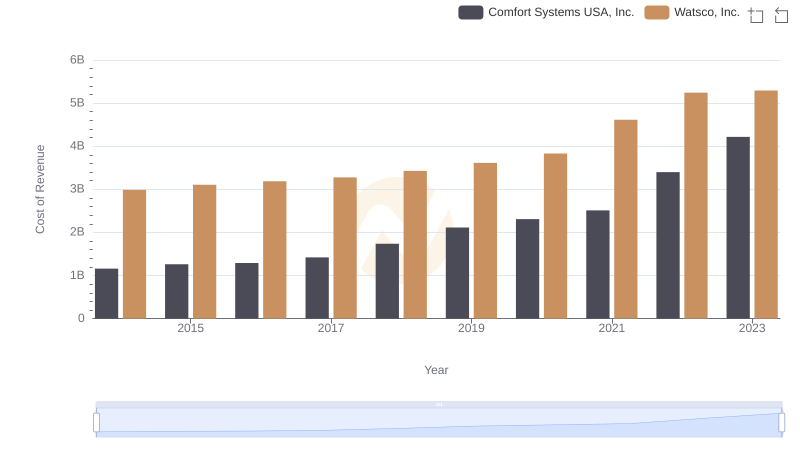
Cost Insights: Breaking Down Watsco, Inc. and Comfort Systems USA, Inc.'s Expenses
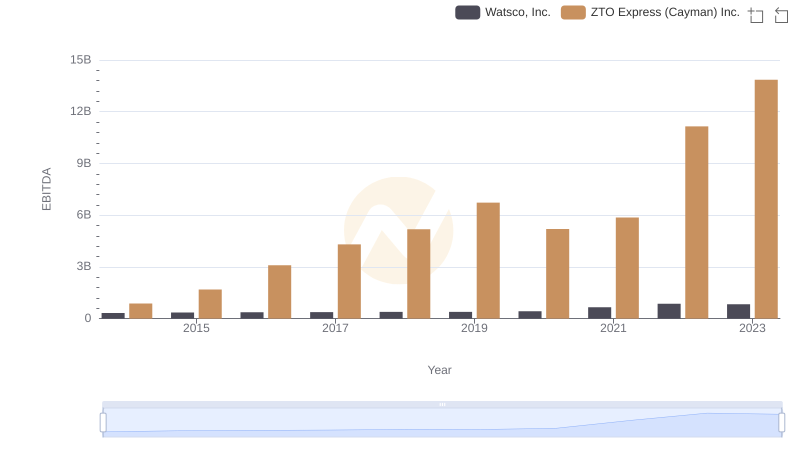
A Side-by-Side Analysis of EBITDA: Watsco, Inc. and ZTO Express (Cayman) Inc.