| __timestamp | Graco Inc. | Union Pacific Corporation |
|---|---|---|
| Wednesday, January 1, 2014 | 554394000 | 14311000000 |
| Thursday, January 1, 2015 | 601785000 | 12837000000 |
| Friday, January 1, 2016 | 621054000 | 11672000000 |
| Sunday, January 1, 2017 | 681695000 | 12231000000 |
| Monday, January 1, 2018 | 770753000 | 13293000000 |
| Tuesday, January 1, 2019 | 786289000 | 12094000000 |
| Wednesday, January 1, 2020 | 795178000 | 10354000000 |
| Friday, January 1, 2021 | 953659000 | 11290000000 |
| Saturday, January 1, 2022 | 1086082000 | 13670000000 |
| Sunday, January 1, 2023 | 1034585000 | 13590000000 |
| Monday, January 1, 2024 | 990855000 | 13211000000 |
Infusing magic into the data realm
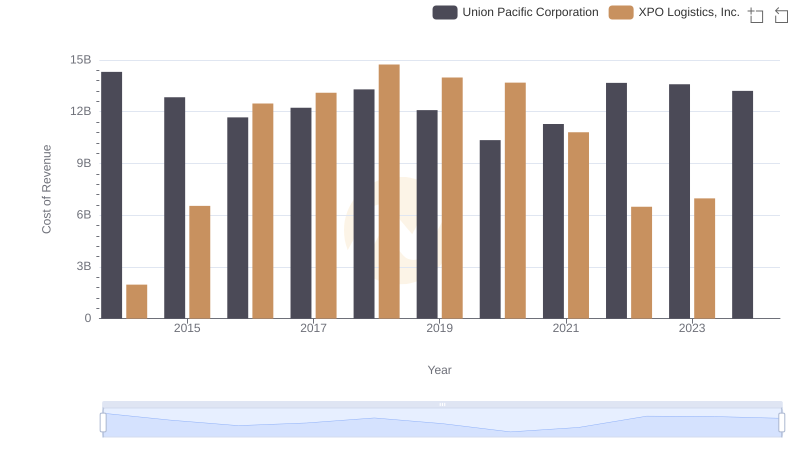
Since 2014, the cost of revenue for Union Pacific Corporation and Graco Inc. has shown intriguing trends. Union Pacific, a titan in the railroad industry, has consistently maintained a higher cost of revenue compared to Graco, a leader in fluid handling systems. In 2014, Union Pacific's cost of revenue was approximately 14.3 billion, while Graco's was around 554 million. Over the years, Union Pacific's cost of revenue has fluctuated, peaking in 2014 and dipping to its lowest in 2020 at about 10.4 billion, reflecting a 27% decrease. Conversely, Graco's cost of revenue has steadily increased, reaching its zenith in 2022 with a 96% rise from 2014. This divergence highlights the contrasting operational dynamics and market strategies of these two companies, offering valuable insights for investors and industry analysts.