| __timestamp | Union Pacific Corporation | XPO Logistics, Inc. |
|---|---|---|
| Wednesday, January 1, 2014 | 10808000000 | 56600000 |
| Thursday, January 1, 2015 | 10290000000 | 298000000 |
| Friday, January 1, 2016 | 9502000000 | 1108300000 |
| Sunday, January 1, 2017 | 10456000000 | 1196700000 |
| Monday, January 1, 2018 | 10802000000 | 1488000000 |
| Tuesday, January 1, 2019 | 11013000000 | 1594000000 |
| Wednesday, January 1, 2020 | 10331000000 | 727000000 |
| Friday, January 1, 2021 | 11843000000 | 741000000 |
| Saturday, January 1, 2022 | 12636000000 | 941000000 |
| Sunday, January 1, 2023 | 11928000000 | 860000000 |
| Monday, January 1, 2024 | 12461000000 | 1186000000 |
Unleashing insights
In the ever-evolving landscape of American transportation, Union Pacific Corporation and XPO Logistics, Inc. have been pivotal players. From 2014 to 2023, Union Pacific's EBITDA consistently outperformed XPO Logistics, showcasing its robust financial health. Union Pacific's EBITDA grew by approximately 16% over this period, peaking in 2022. In contrast, XPO Logistics experienced a more volatile journey, with its EBITDA peaking in 2019 before a noticeable decline.
Union Pacific's steady growth reflects its strategic investments and operational efficiency, while XPO's fluctuations highlight the challenges and opportunities in the logistics sector. Notably, data for 2024 is incomplete, leaving room for speculation on future trends. This comparison underscores the resilience of established rail networks against the dynamic logistics industry, offering valuable insights for investors and industry analysts alike.
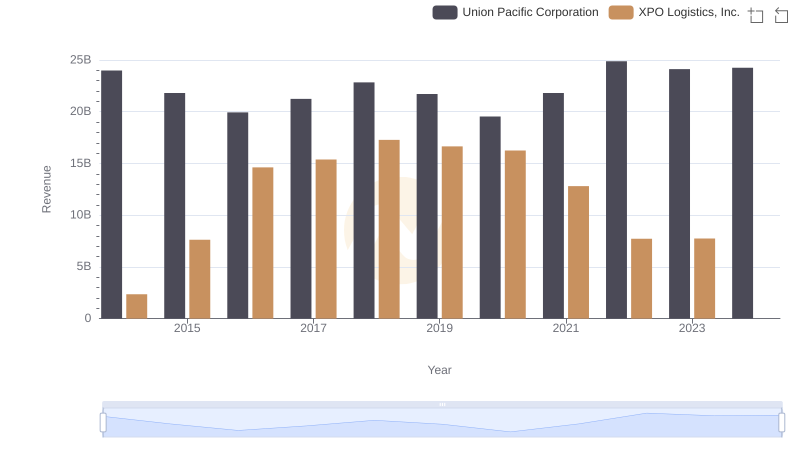
Annual Revenue Comparison: Union Pacific Corporation vs XPO Logistics, Inc.
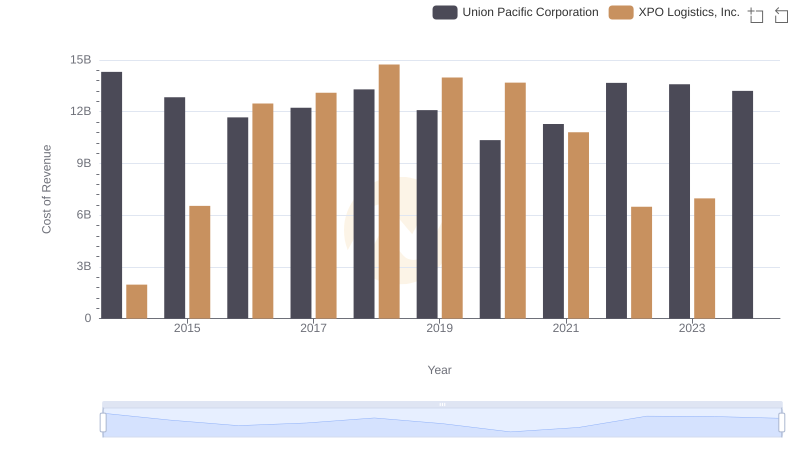
Comparing Cost of Revenue Efficiency: Union Pacific Corporation vs XPO Logistics, Inc.
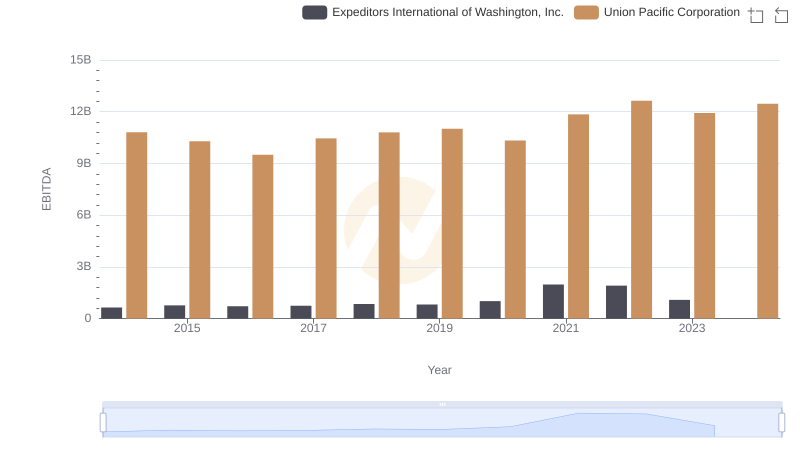
A Professional Review of EBITDA: Union Pacific Corporation Compared to Expeditors International of Washington, Inc.
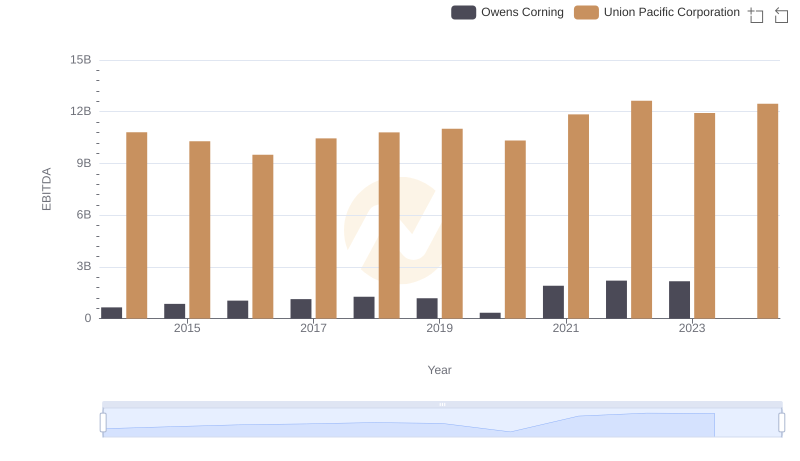
Professional EBITDA Benchmarking: Union Pacific Corporation vs Owens Corning