| __timestamp | CSX Corporation | Carlisle Companies Incorporated |
|---|---|---|
| Wednesday, January 1, 2014 | 9056000000 | 2384500000 |
| Thursday, January 1, 2015 | 8227000000 | 2536500000 |
| Friday, January 1, 2016 | 7680000000 | 2518100000 |
| Sunday, January 1, 2017 | 7635000000 | 2941900000 |
| Monday, January 1, 2018 | 7477000000 | 3304800000 |
| Tuesday, January 1, 2019 | 7063000000 | 3439900000 |
| Wednesday, January 1, 2020 | 6221000000 | 2832500000 |
| Friday, January 1, 2021 | 7382000000 | 3495600000 |
| Saturday, January 1, 2022 | 9068000000 | 4434500000 |
| Sunday, January 1, 2023 | 9130000000 | 3042900000 |
| Monday, January 1, 2024 | 3115900000 |
Cracking the code
In the ever-evolving landscape of American industry, cost efficiency remains a pivotal factor for success. Over the past decade, CSX Corporation and Carlisle Companies Incorporated have demonstrated contrasting approaches to managing their cost of revenue. From 2014 to 2023, CSX Corporation consistently maintained a higher cost of revenue, peaking at approximately $9.13 billion in 2023. In contrast, Carlisle Companies saw a significant rise, reaching its zenith in 2022 with a cost of revenue of around $4.43 billion, marking an 86% increase from 2014.
This comparison highlights CSX's steady approach, with a 31% reduction in cost from 2014 to 2020, before a resurgence. Meanwhile, Carlisle's trajectory reflects a more volatile yet upward trend. These insights underscore the diverse strategies employed by these industry giants in navigating economic challenges and opportunities.
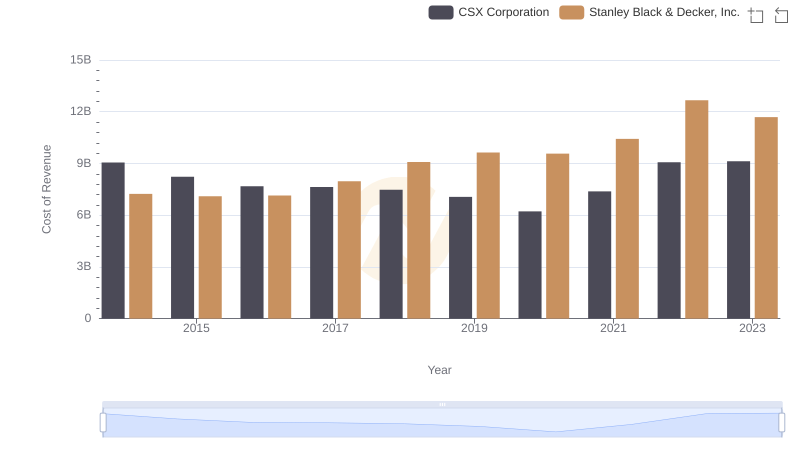
Cost Insights: Breaking Down CSX Corporation and Stanley Black & Decker, Inc.'s Expenses
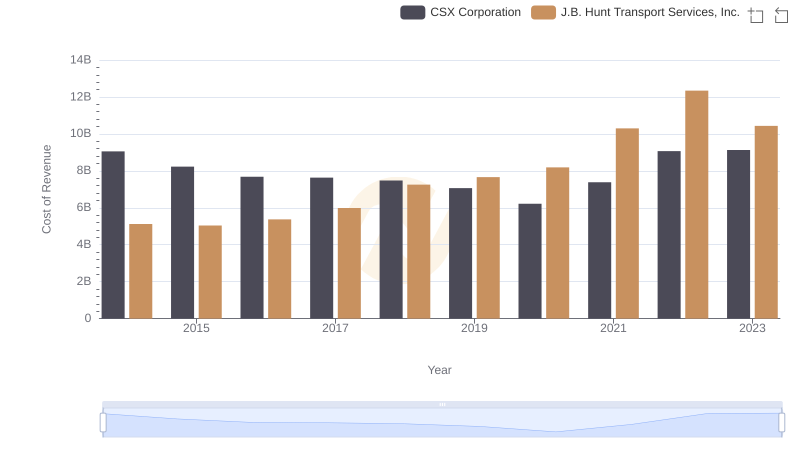
Analyzing Cost of Revenue: CSX Corporation and J.B. Hunt Transport Services, Inc.
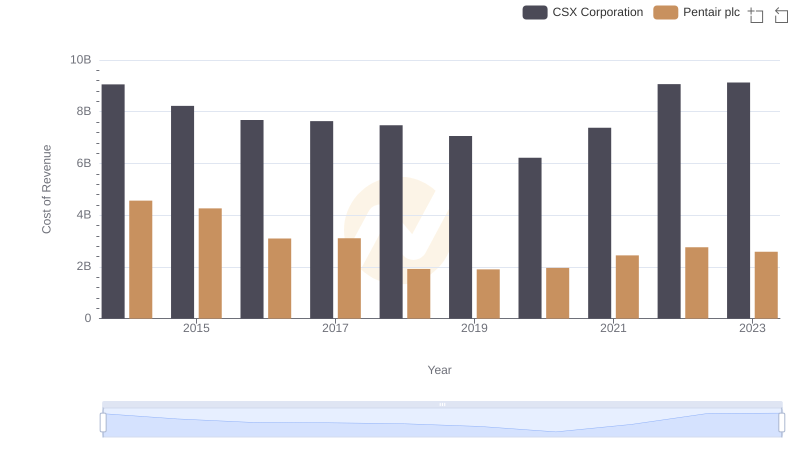
Cost of Revenue: Key Insights for CSX Corporation and Pentair plc
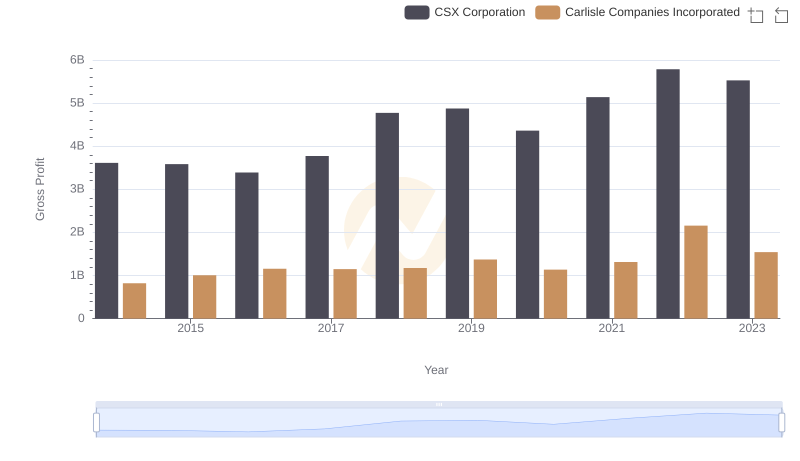
Gross Profit Analysis: Comparing CSX Corporation and Carlisle Companies Incorporated