| __timestamp | CSX Corporation | Carlisle Companies Incorporated |
|---|---|---|
| Wednesday, January 1, 2014 | 3613000000 | 819500000 |
| Thursday, January 1, 2015 | 3584000000 | 1006700000 |
| Friday, January 1, 2016 | 3389000000 | 1157300000 |
| Sunday, January 1, 2017 | 3773000000 | 1148000000 |
| Monday, January 1, 2018 | 4773000000 | 1174700000 |
| Tuesday, January 1, 2019 | 4874000000 | 1371700000 |
| Wednesday, January 1, 2020 | 4362000000 | 1137400000 |
| Friday, January 1, 2021 | 5140000000 | 1314700000 |
| Saturday, January 1, 2022 | 5785000000 | 2157400000 |
| Sunday, January 1, 2023 | 5527000000 | 1544000000 |
| Monday, January 1, 2024 | 1887700000 |
Unveiling the hidden dimensions of data
In the ever-evolving landscape of American industry, the financial performance of companies like CSX Corporation and Carlisle Companies Incorporated offers a fascinating glimpse into their strategic prowess. Over the past decade, CSX Corporation has consistently outperformed Carlisle Companies in terms of gross profit. From 2014 to 2023, CSX's gross profit surged by approximately 53%, peaking in 2022. In contrast, Carlisle Companies saw a more modest increase of around 88% during the same period, with a notable spike in 2022.
These trends underscore the dynamic nature of the U.S. market, where strategic decisions and market conditions shape financial outcomes.
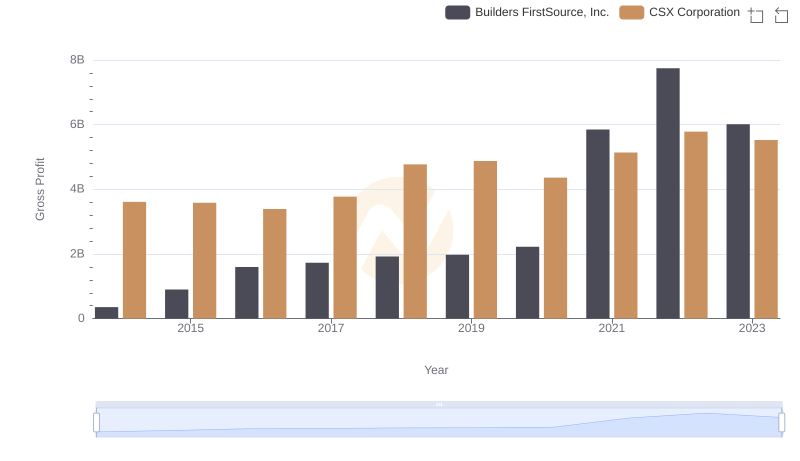
Gross Profit Trends Compared: CSX Corporation vs Builders FirstSource, Inc.
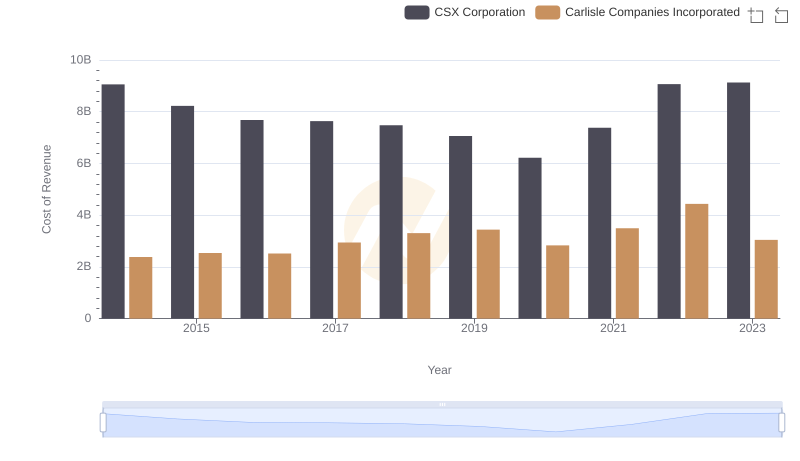
Comparing Cost of Revenue Efficiency: CSX Corporation vs Carlisle Companies Incorporated
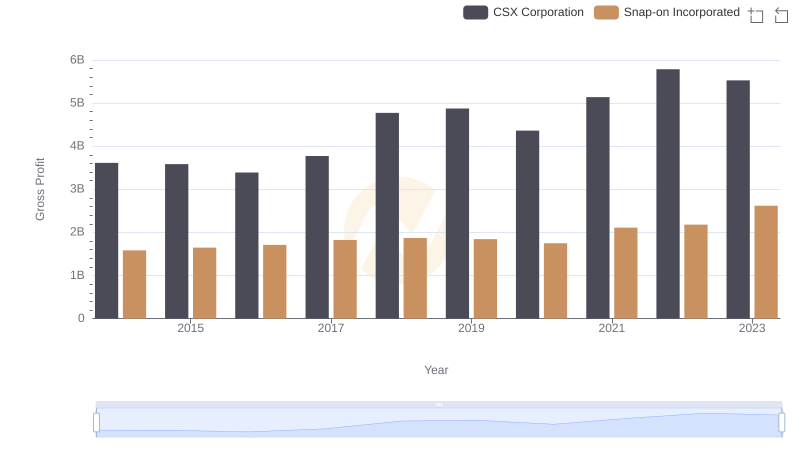
Gross Profit Comparison: CSX Corporation and Snap-on Incorporated Trends
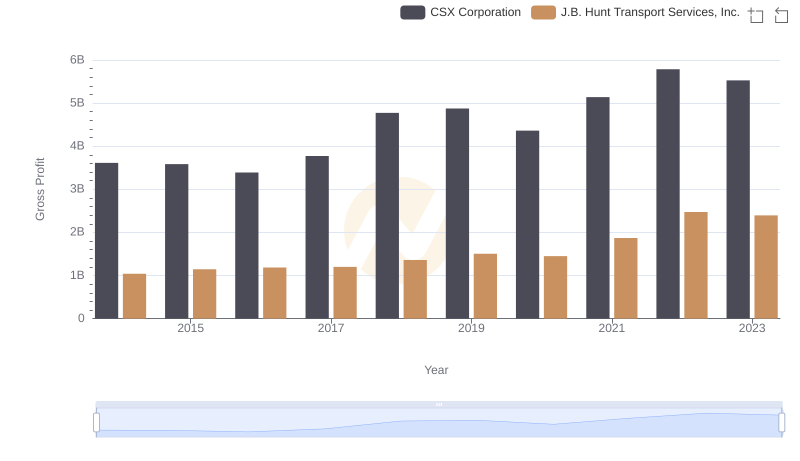
Who Generates Higher Gross Profit? CSX Corporation or J.B. Hunt Transport Services, Inc.