| __timestamp | AerCap Holdings N.V. | Union Pacific Corporation |
|---|---|---|
| Wednesday, January 1, 2014 | 3535797000 | 23988000000 |
| Thursday, January 1, 2015 | 5598662000 | 21813000000 |
| Friday, January 1, 2016 | 5152131000 | 19941000000 |
| Sunday, January 1, 2017 | 5037493000 | 21240000000 |
| Monday, January 1, 2018 | 4799980000 | 22832000000 |
| Tuesday, January 1, 2019 | 4937340000 | 21708000000 |
| Wednesday, January 1, 2020 | 4493629000 | 19533000000 |
| Friday, January 1, 2021 | 4588930000 | 21804000000 |
| Saturday, January 1, 2022 | 6914985000 | 24875000000 |
| Sunday, January 1, 2023 | 7574664000 | 24119000000 |
| Monday, January 1, 2024 | 24250000000 |
Unlocking the unknown
In the world of corporate giants, Union Pacific Corporation and AerCap Holdings N.V. stand as titans in their respective industries. Over the past decade, Union Pacific has consistently outpaced AerCap in annual revenue, showcasing its dominance in the transportation sector. From 2014 to 2023, Union Pacific's revenue has hovered around $22 billion, peaking at $24.9 billion in 2022. In contrast, AerCap, a leader in aircraft leasing, has seen its revenue grow from $3.5 billion in 2014 to a high of $7.6 billion in 2023, marking a significant 115% increase.
Despite AerCap's impressive growth, Union Pacific's revenue remains approximately three times larger, underscoring its robust market position. The data for 2024 is incomplete, but the trend suggests Union Pacific's continued leadership. This revenue comparison highlights the dynamic nature of these industries and the strategic maneuvers each company employs to maintain their market positions.

Union Pacific Corporation vs Watsco, Inc.: Examining Key Revenue Metrics
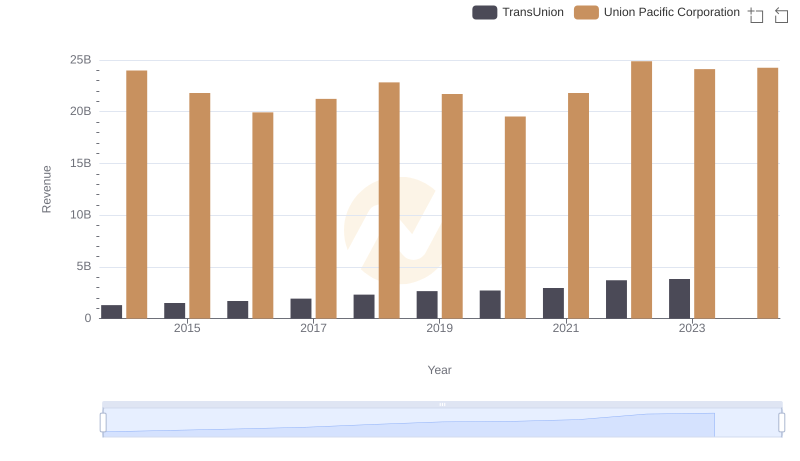
Who Generates More Revenue? Union Pacific Corporation or TransUnion
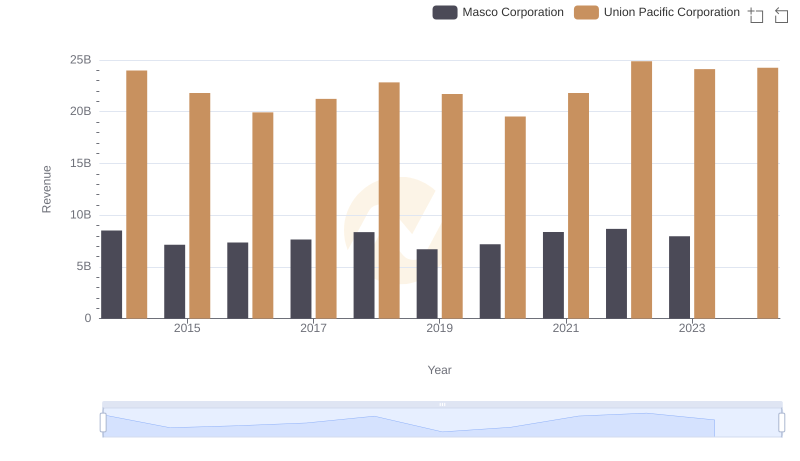
Annual Revenue Comparison: Union Pacific Corporation vs Masco Corporation
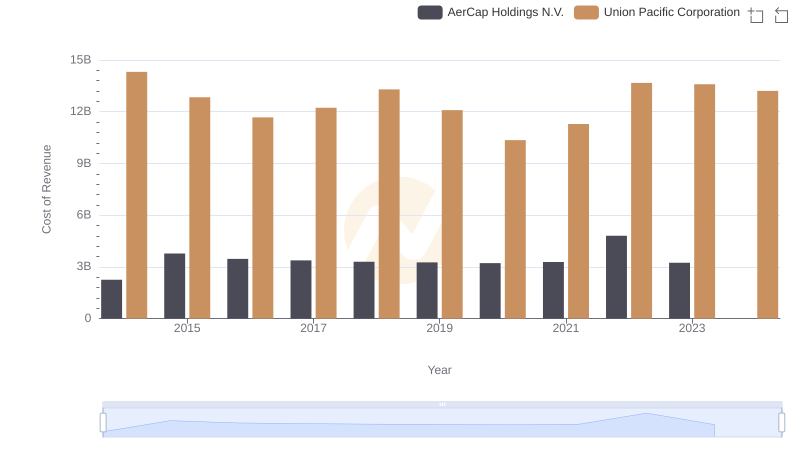
Analyzing Cost of Revenue: Union Pacific Corporation and AerCap Holdings N.V.
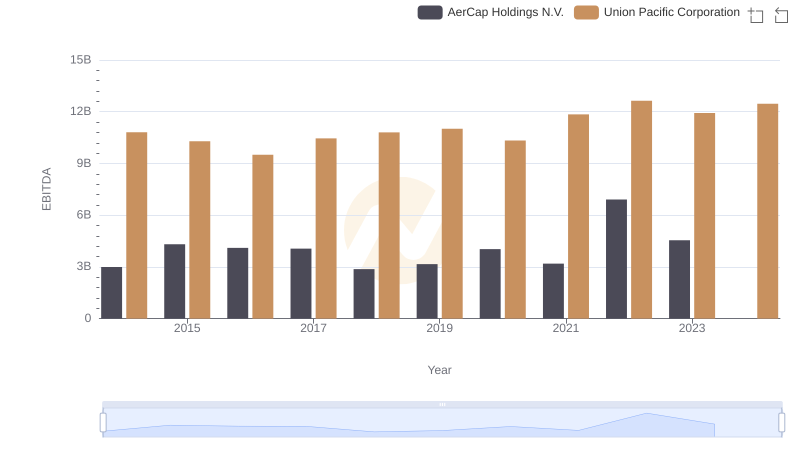
Comparative EBITDA Analysis: Union Pacific Corporation vs AerCap Holdings N.V.