| __timestamp | Cintas Corporation | Illinois Tool Works Inc. |
|---|---|---|
| Wednesday, January 1, 2014 | 793811000 | 3453000000 |
| Thursday, January 1, 2015 | 877761000 | 3420000000 |
| Friday, January 1, 2016 | 933728000 | 3534000000 |
| Sunday, January 1, 2017 | 968293000 | 3861000000 |
| Monday, January 1, 2018 | 1227852000 | 4065000000 |
| Tuesday, January 1, 2019 | 1564228000 | 3852000000 |
| Wednesday, January 1, 2020 | 1542737000 | 3322000000 |
| Friday, January 1, 2021 | 1773591000 | 3910000000 |
| Saturday, January 1, 2022 | 1990046000 | 4241000000 |
| Sunday, January 1, 2023 | 2221676000 | 4484000000 |
| Monday, January 1, 2024 | 2523857000 | 4264000000 |
Igniting the spark of knowledge
In the competitive landscape of industrial giants, Cintas Corporation and Illinois Tool Works Inc. have showcased remarkable EBITDA growth over the past decade. Since 2014, Cintas has seen its EBITDA soar by over 200%, reflecting its strategic expansions and operational efficiencies. Meanwhile, Illinois Tool Works, a stalwart in the industry, has maintained a steady EBITDA growth of approximately 30%, underscoring its resilience and market adaptability.
This comparison highlights the dynamic strategies and market positions of these two industrial leaders, offering valuable insights into their financial health and future prospects.
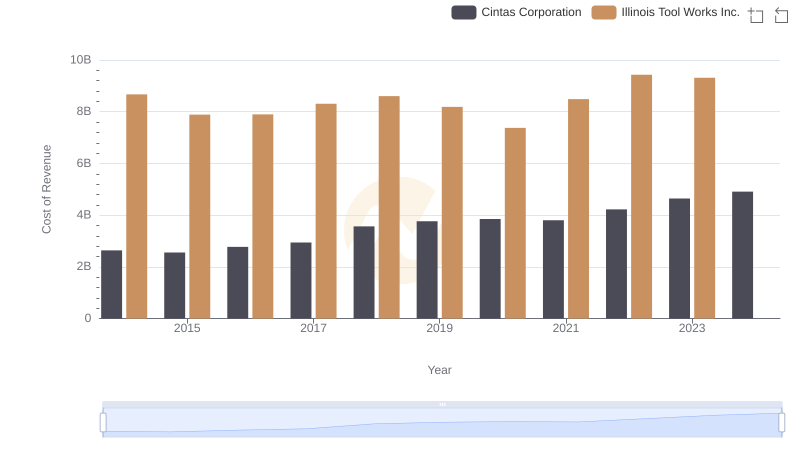
Cost of Revenue Comparison: Cintas Corporation vs Illinois Tool Works Inc.
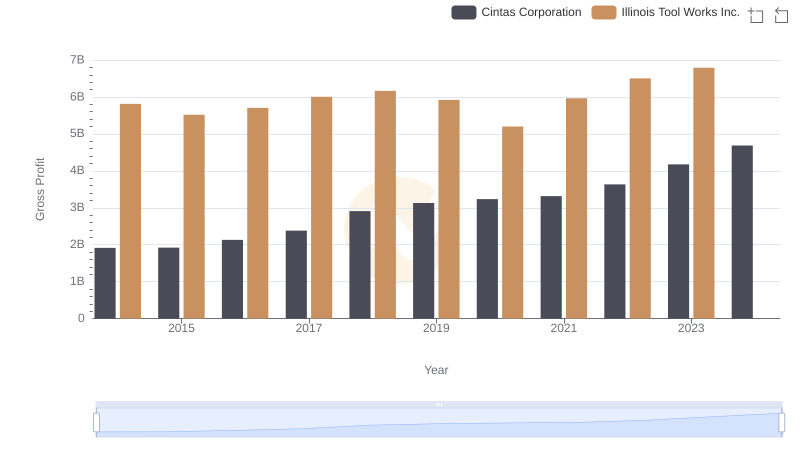
Key Insights on Gross Profit: Cintas Corporation vs Illinois Tool Works Inc.
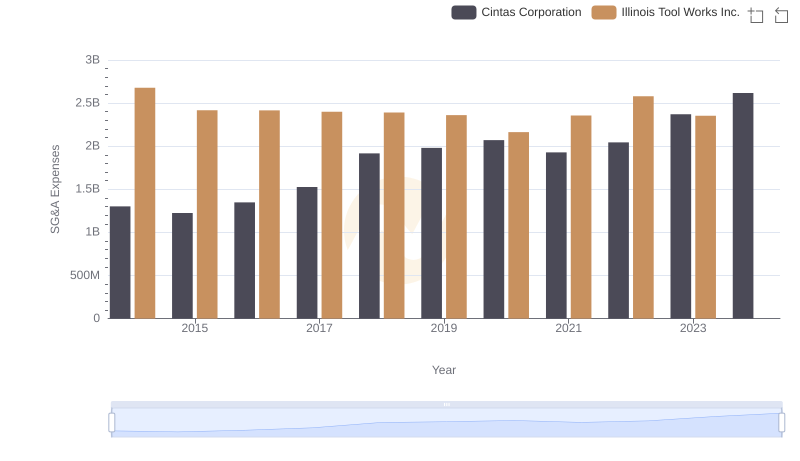
Breaking Down SG&A Expenses: Cintas Corporation vs Illinois Tool Works Inc.
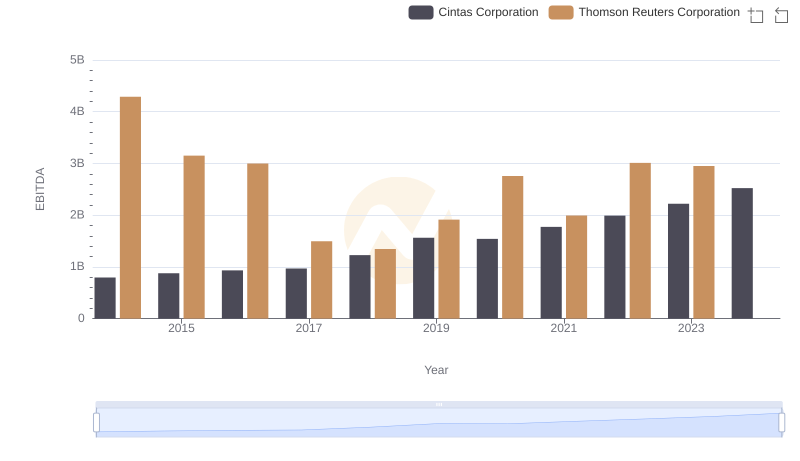
EBITDA Analysis: Evaluating Cintas Corporation Against Thomson Reuters Corporation
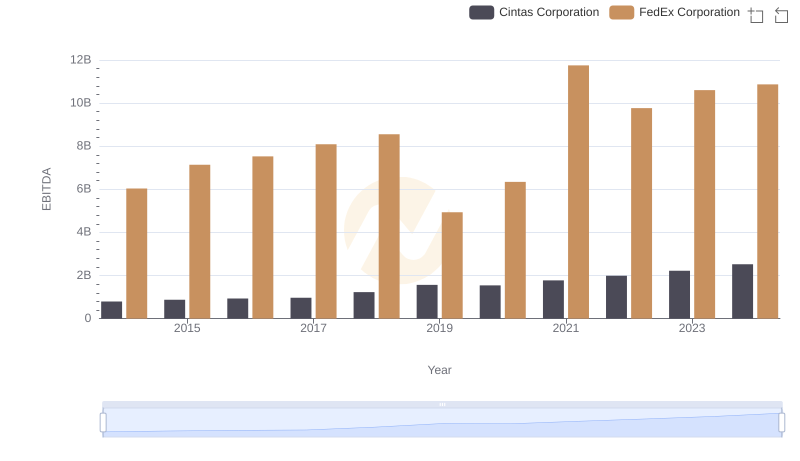
Professional EBITDA Benchmarking: Cintas Corporation vs FedEx Corporation
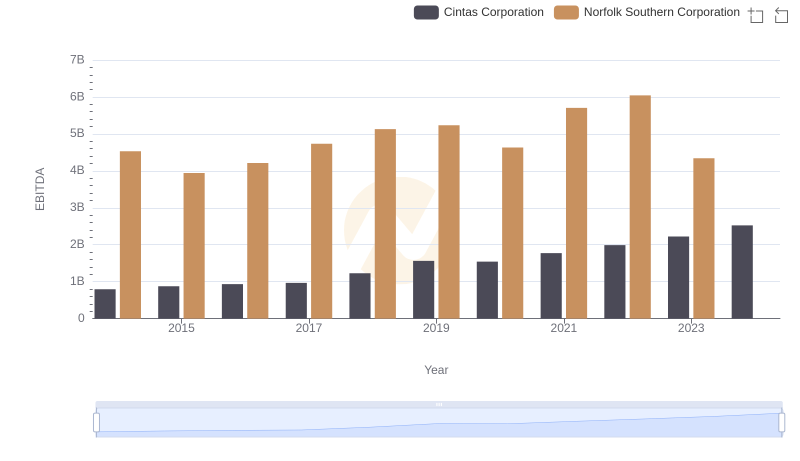
A Side-by-Side Analysis of EBITDA: Cintas Corporation and Norfolk Southern Corporation
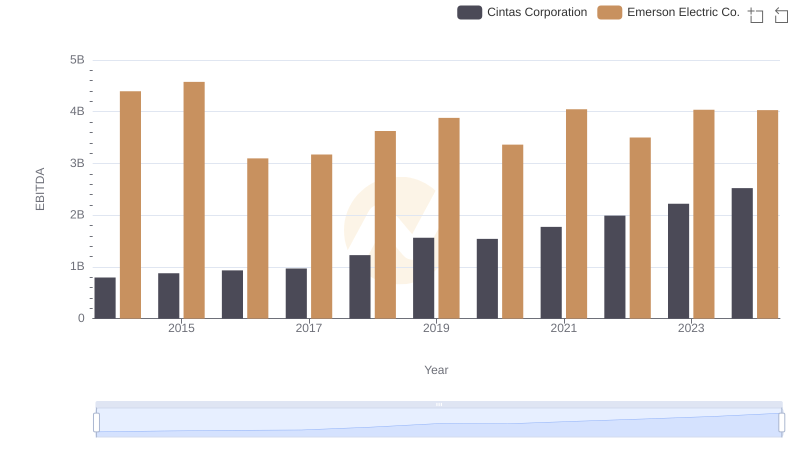
Comparative EBITDA Analysis: Cintas Corporation vs Emerson Electric Co.
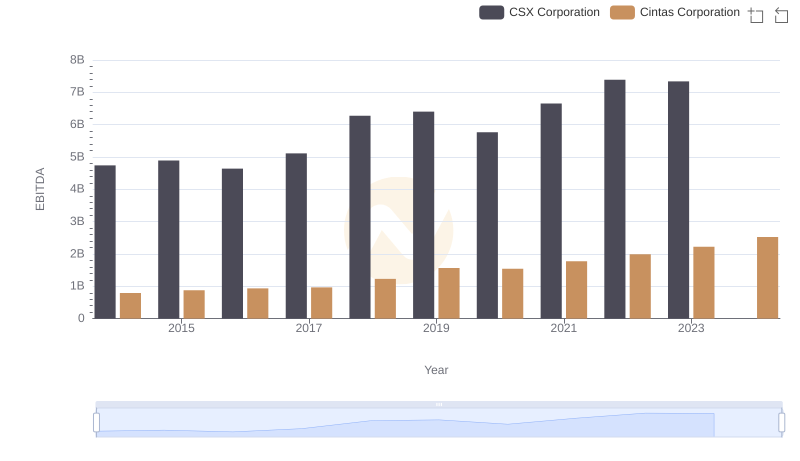
A Side-by-Side Analysis of EBITDA: Cintas Corporation and CSX Corporation
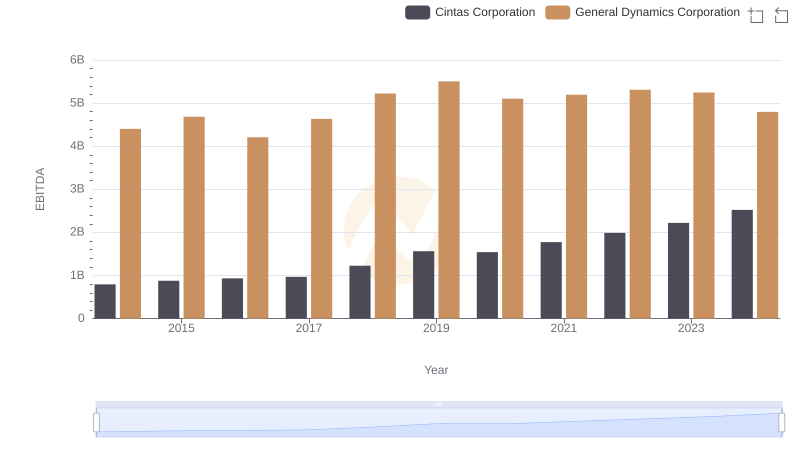
Comparative EBITDA Analysis: Cintas Corporation vs General Dynamics Corporation
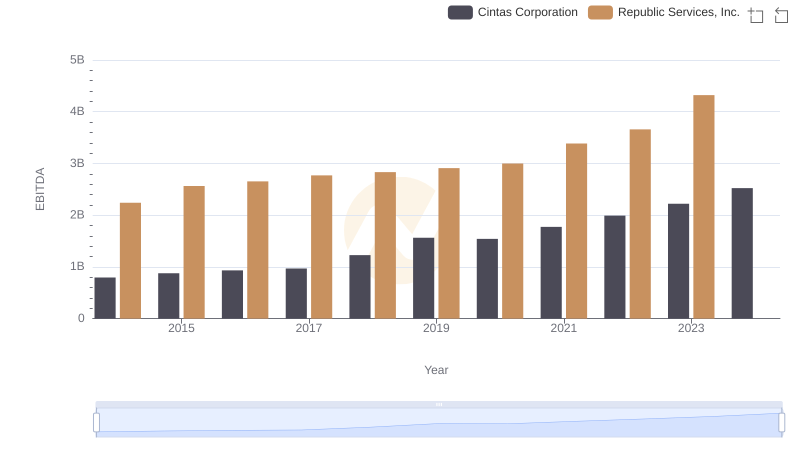
Cintas Corporation and Republic Services, Inc.: A Detailed Examination of EBITDA Performance