| __timestamp | Caterpillar Inc. | Honeywell International Inc. |
|---|---|---|
| Wednesday, January 1, 2014 | 14793000000 | 11349000000 |
| Thursday, January 1, 2015 | 12878000000 | 11834000000 |
| Friday, January 1, 2016 | 9632000000 | 12152000000 |
| Sunday, January 1, 2017 | 13767000000 | 12959000000 |
| Monday, January 1, 2018 | 17003000000 | 12756000000 |
| Tuesday, January 1, 2019 | 16416000000 | 12370000000 |
| Wednesday, January 1, 2020 | 12077000000 | 10468000000 |
| Friday, January 1, 2021 | 15003000000 | 10998000000 |
| Saturday, January 1, 2022 | 17512000000 | 11641000000 |
| Sunday, January 1, 2023 | 23263000000 | 13667000000 |
| Monday, January 1, 2024 | 23324000000 | 14662000000 |
Infusing magic into the data realm
In the ever-evolving landscape of industrial giants, Caterpillar Inc. and Honeywell International Inc. have long been at the forefront of innovation and growth. Over the past decade, from 2014 to 2023, these two titans have showcased distinct trajectories in their gross profit trends.
Caterpillar Inc. has demonstrated a remarkable upward trend, with its gross profit surging by approximately 57% from 2014 to 2023. This growth is particularly notable in the last year, where it reached its peak, reflecting the company's robust strategies and market adaptability. In contrast, Honeywell International Inc. has experienced a steadier, albeit slower, growth rate of around 20% over the same period. Despite facing challenges in 2020, Honeywell's resilience is evident in its recovery and subsequent growth.
These trends not only highlight the dynamic nature of the industrial sector but also underscore the strategic differences between these two industry leaders.
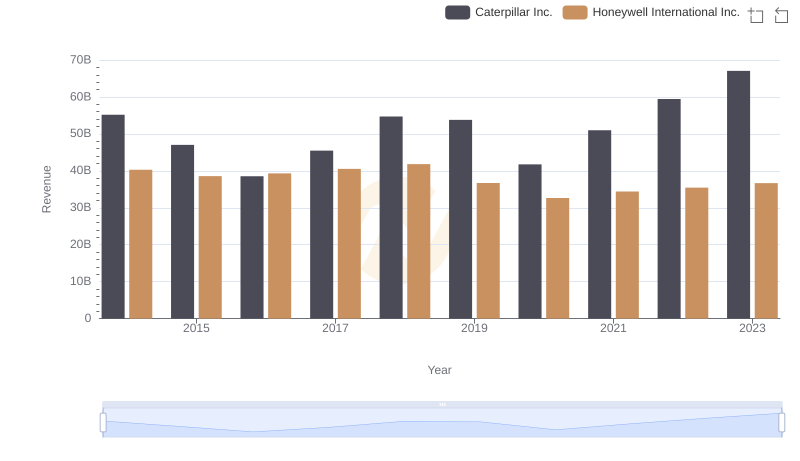
Caterpillar Inc. vs Honeywell International Inc.: Annual Revenue Growth Compared

Caterpillar Inc. vs Honeywell International Inc.: Efficiency in Cost of Revenue Explored

Gross Profit Comparison: Caterpillar Inc. and Lockheed Martin Corporation Trends

Who Generates Higher Gross Profit? Caterpillar Inc. or Automatic Data Processing, Inc.

SG&A Efficiency Analysis: Comparing Caterpillar Inc. and Honeywell International Inc.