| __timestamp | Caterpillar Inc. | Cintas Corporation |
|---|---|---|
| Wednesday, January 1, 2014 | 6929000000 | 793811000 |
| Thursday, January 1, 2015 | 7705000000 | 877761000 |
| Friday, January 1, 2016 | 3671000000 | 933728000 |
| Sunday, January 1, 2017 | 7482000000 | 968293000 |
| Monday, January 1, 2018 | 11102000000 | 1227852000 |
| Tuesday, January 1, 2019 | 10690000000 | 1564228000 |
| Wednesday, January 1, 2020 | 7267000000 | 1542737000 |
| Friday, January 1, 2021 | 10627000000 | 1773591000 |
| Saturday, January 1, 2022 | 11974000000 | 1990046000 |
| Sunday, January 1, 2023 | 15705000000 | 2221676000 |
| Monday, January 1, 2024 | 16038000000 | 2523857000 |
Unleashing the power of data
In the world of industrial and service giants, Caterpillar Inc. and Cintas Corporation have carved distinct paths over the past decade. From 2014 to 2023, Caterpillar's EBITDA has shown a remarkable growth trajectory, peaking at approximately $15.7 billion in 2023, a staggering 127% increase from its 2016 low. This reflects Caterpillar's resilience and strategic prowess in navigating economic cycles.
Conversely, Cintas Corporation, a leader in corporate identity uniform programs, has steadily increased its EBITDA by about 180% over the same period, reaching around $2.2 billion in 2023. This consistent growth underscores Cintas's robust business model and adaptability in the service sector.
While Caterpillar's EBITDA figures are significantly higher, Cintas's growth rate is impressive, highlighting the diverse strategies and market dynamics at play. The data for 2024 remains incomplete, leaving room for speculation on future trends.
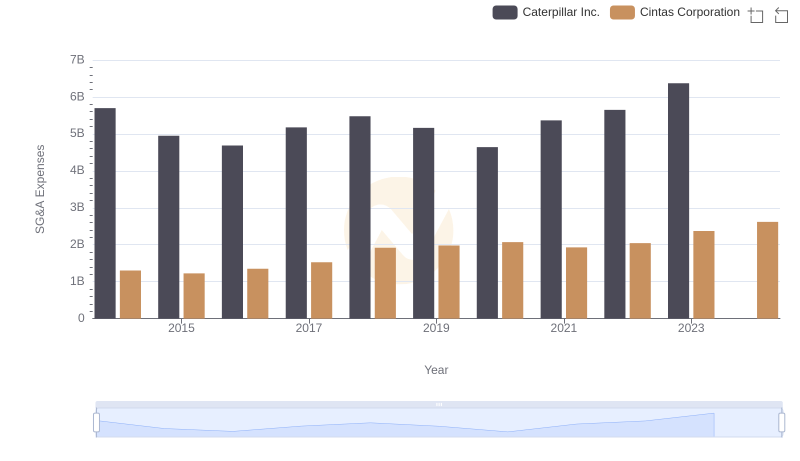
Comparing SG&A Expenses: Caterpillar Inc. vs Cintas Corporation Trends and Insights
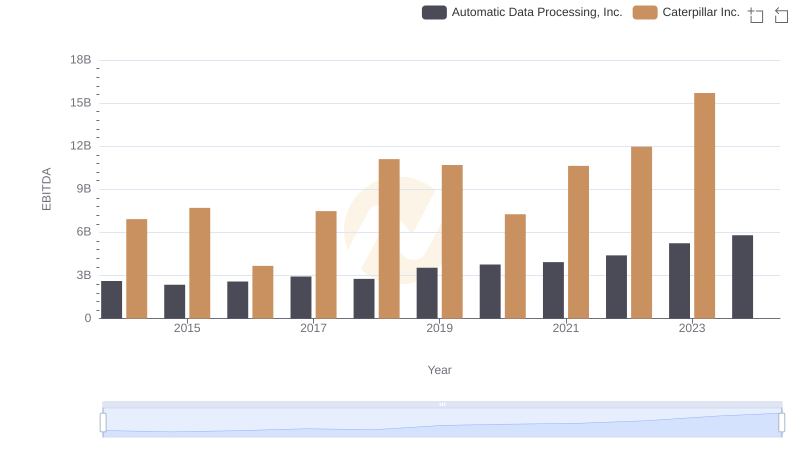
Professional EBITDA Benchmarking: Caterpillar Inc. vs Automatic Data Processing, Inc.
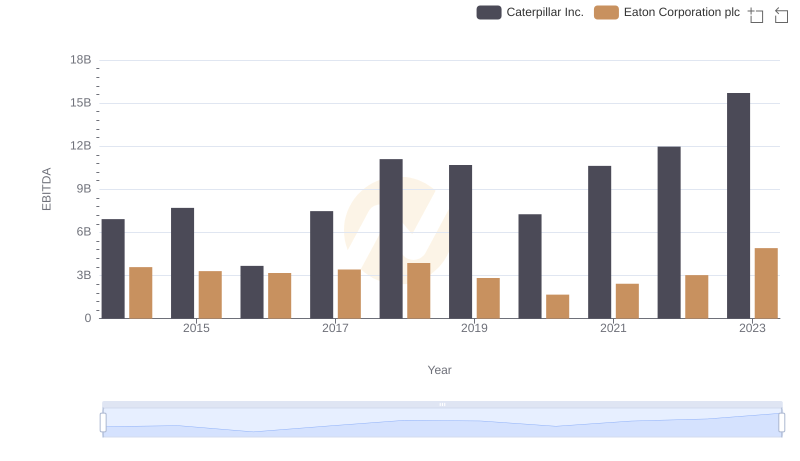
Caterpillar Inc. and Eaton Corporation plc: A Detailed Examination of EBITDA Performance

Comparative EBITDA Analysis: Caterpillar Inc. vs Trane Technologies plc