| __timestamp | Adobe Inc. | VeriSign, Inc. |
|---|---|---|
| Wednesday, January 1, 2014 | 2215140000 | 189488000 |
| Thursday, January 1, 2015 | 2215161000 | 196914000 |
| Friday, January 1, 2016 | 2487907000 | 198253000 |
| Sunday, January 1, 2017 | 2822298000 | 211705000 |
| Monday, January 1, 2018 | 3365727000 | 197559000 |
| Tuesday, January 1, 2019 | 4124984000 | 184262000 |
| Wednesday, January 1, 2020 | 4559000000 | 186003000 |
| Friday, January 1, 2021 | 5406000000 | 188311000 |
| Saturday, January 1, 2022 | 6187000000 | 195400000 |
| Sunday, January 1, 2023 | 6764000000 | 204200000 |
| Monday, January 1, 2024 | 7293000000 | 211100000 |
Unveiling the hidden dimensions of data
In the ever-evolving landscape of technology, understanding the financial dynamics of industry leaders is crucial. Adobe Inc. and VeriSign, Inc. have been pivotal players, each with unique strategies reflected in their Selling, General, and Administrative (SG&A) expenses over the past decade.
From 2014 to 2023, Adobe's SG&A expenses have surged by over 200%, highlighting its aggressive growth strategy. This increase underscores Adobe's commitment to expanding its market presence and investing in innovation. By 2023, Adobe's SG&A expenses reached a staggering 6.76 billion, a testament to its robust expansion efforts.
In contrast, VeriSign's SG&A expenses have remained relatively stable, with a modest increase of around 8% over the same period. This stability reflects VeriSign's focus on maintaining its core operations and ensuring consistent service delivery.
The data for 2024 is incomplete, offering a glimpse into the future yet to unfold.
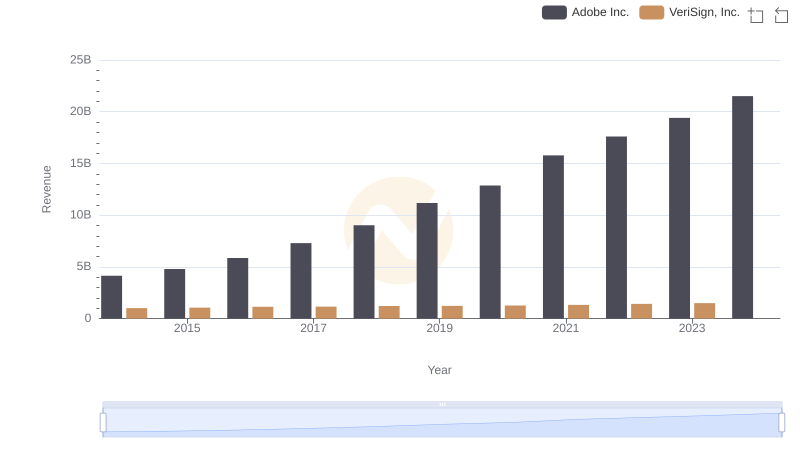
Adobe Inc. and VeriSign, Inc.: A Comprehensive Revenue Analysis
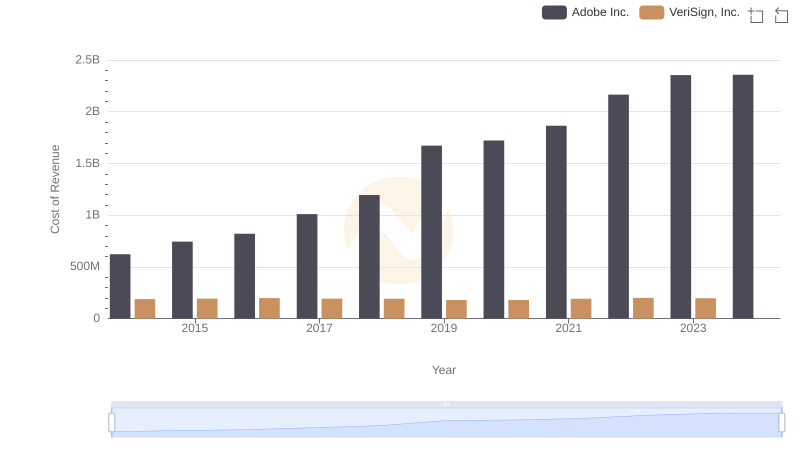
Cost Insights: Breaking Down Adobe Inc. and VeriSign, Inc.'s Expenses
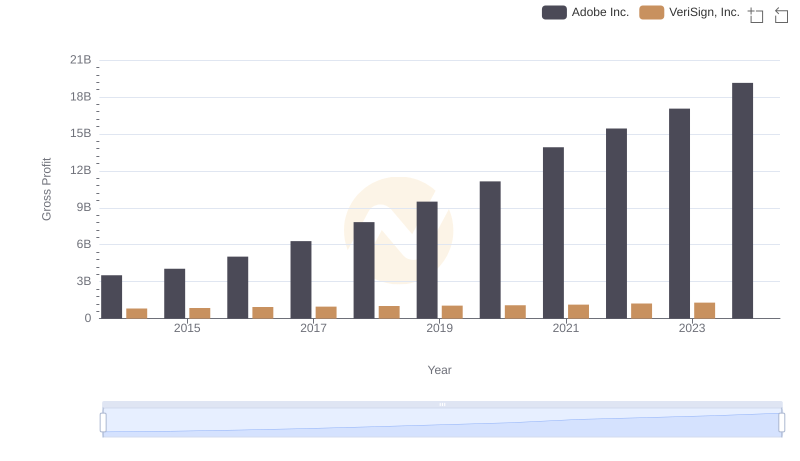
Gross Profit Trends Compared: Adobe Inc. vs VeriSign, Inc.
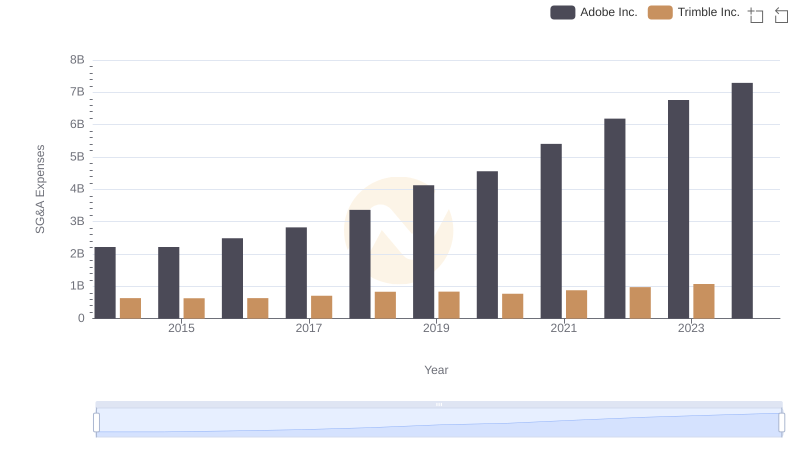
SG&A Efficiency Analysis: Comparing Adobe Inc. and Trimble Inc.
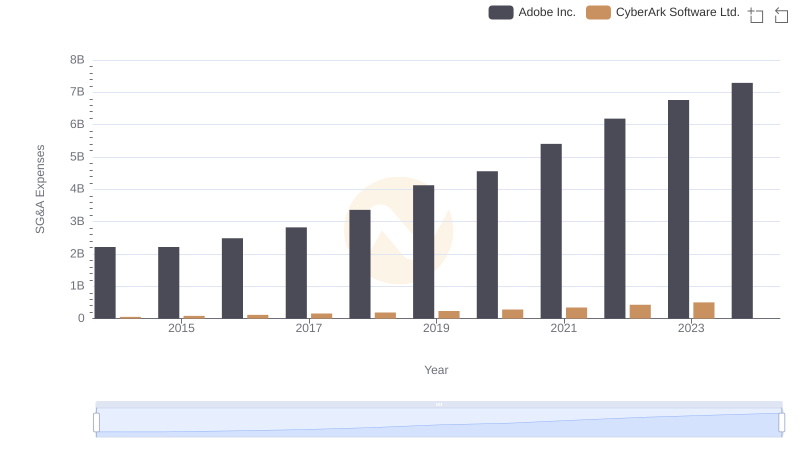
Adobe Inc. or CyberArk Software Ltd.: Who Manages SG&A Costs Better?
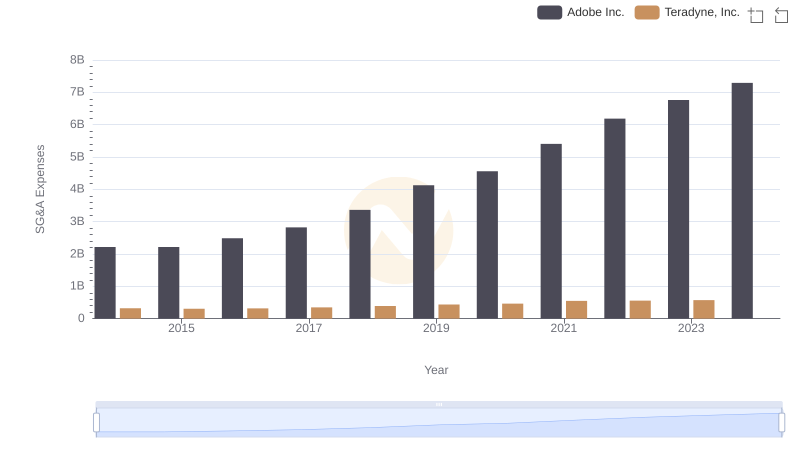
Breaking Down SG&A Expenses: Adobe Inc. vs Teradyne, Inc.
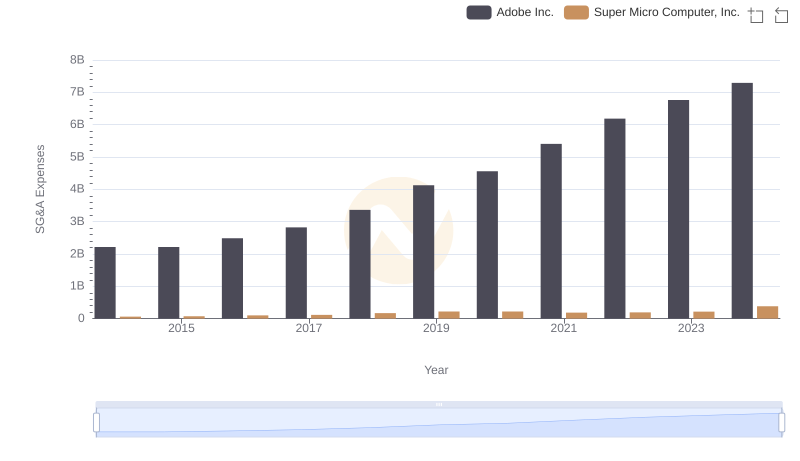
Who Optimizes SG&A Costs Better? Adobe Inc. or Super Micro Computer, Inc.
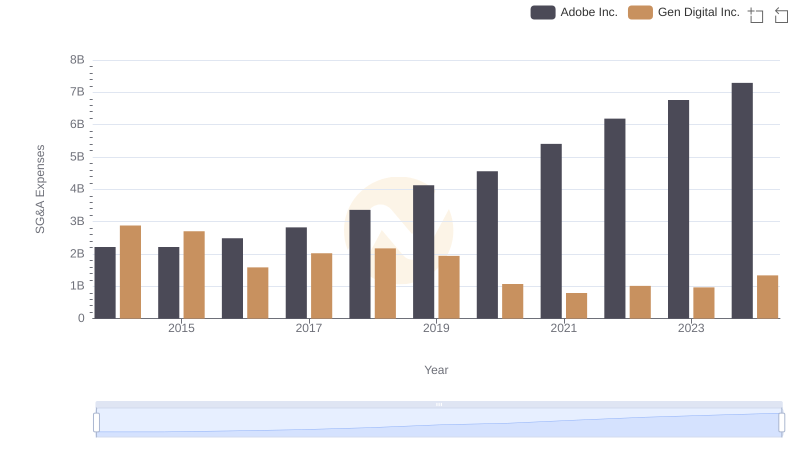
Cost Management Insights: SG&A Expenses for Adobe Inc. and Gen Digital Inc.
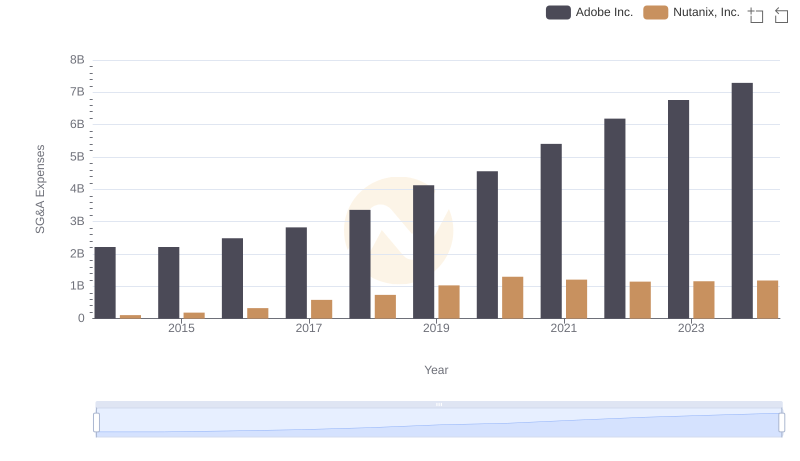
Cost Management Insights: SG&A Expenses for Adobe Inc. and Nutanix, Inc.
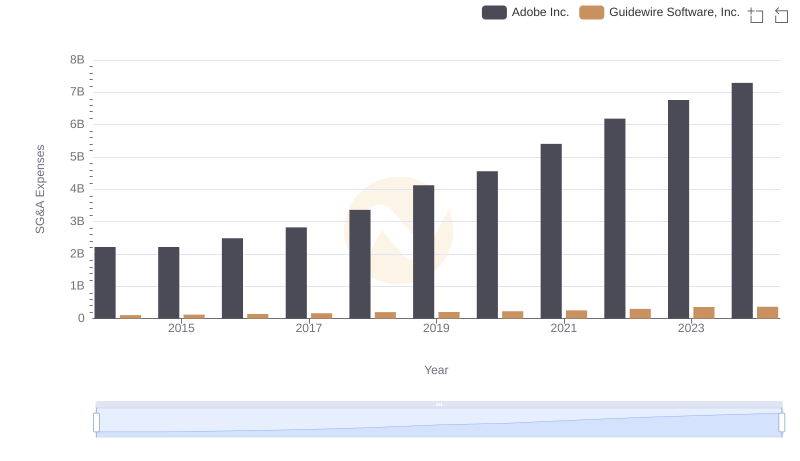
Adobe Inc. and Guidewire Software, Inc.: SG&A Spending Patterns Compared
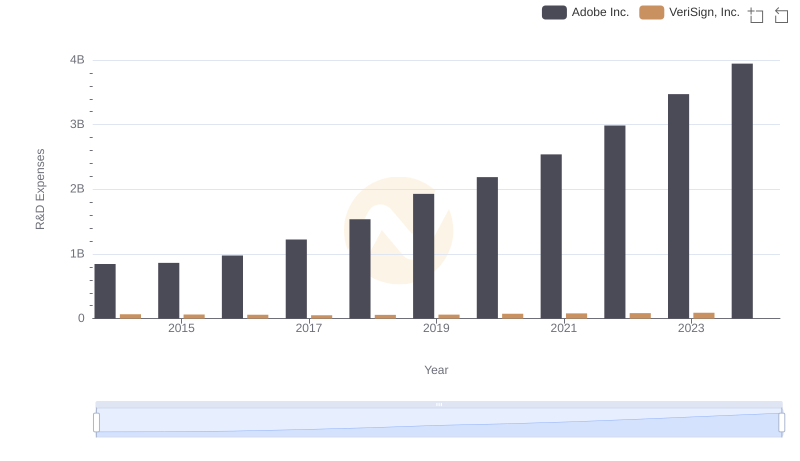
Research and Development: Comparing Key Metrics for Adobe Inc. and VeriSign, Inc.
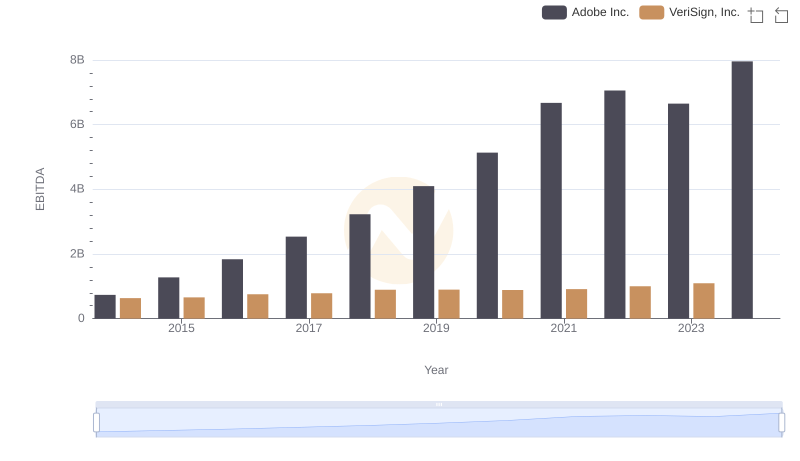
A Professional Review of EBITDA: Adobe Inc. Compared to VeriSign, Inc.