| __timestamp | CNH Industrial N.V. | The Boeing Company |
|---|---|---|
| Wednesday, January 1, 2014 | 32555000000 | 90762000000 |
| Thursday, January 1, 2015 | 25912000000 | 96114000000 |
| Friday, January 1, 2016 | 24872000000 | 94571000000 |
| Sunday, January 1, 2017 | 27361000000 | 93392000000 |
| Monday, January 1, 2018 | 29706000000 | 101127000000 |
| Tuesday, January 1, 2019 | 28079000000 | 76559000000 |
| Wednesday, January 1, 2020 | 26032000000 | 58158000000 |
| Friday, January 1, 2021 | 33428000000 | 62286000000 |
| Saturday, January 1, 2022 | 23551000000 | 66608000000 |
| Sunday, January 1, 2023 | 24694000000 | 77794000000 |
| Monday, January 1, 2024 | 66517000000 |
Data in motion
In the ever-evolving landscape of global industry, The Boeing Company and CNH Industrial N.V. stand as titans in their respective fields. From 2014 to 2023, Boeing's revenue trajectory reveals a rollercoaster of highs and lows, peaking in 2018 with a staggering 101 billion USD, only to dip significantly in 2020, reflecting the pandemic's impact. Meanwhile, CNH Industrial's revenue remained relatively stable, averaging around 27 billion USD annually, showcasing resilience amidst global economic shifts.
Boeing's revenue in 2023 rebounded to approximately 78 billion USD, a 34% increase from its 2020 low, signaling recovery. In contrast, CNH Industrial's revenue saw a slight decline in 2022, but the company maintained a steady course overall. Missing data for 2024 suggests an incomplete picture, yet the trends highlight the dynamic nature of these industrial powerhouses. Explore how these giants navigate the challenges of a changing world economy.
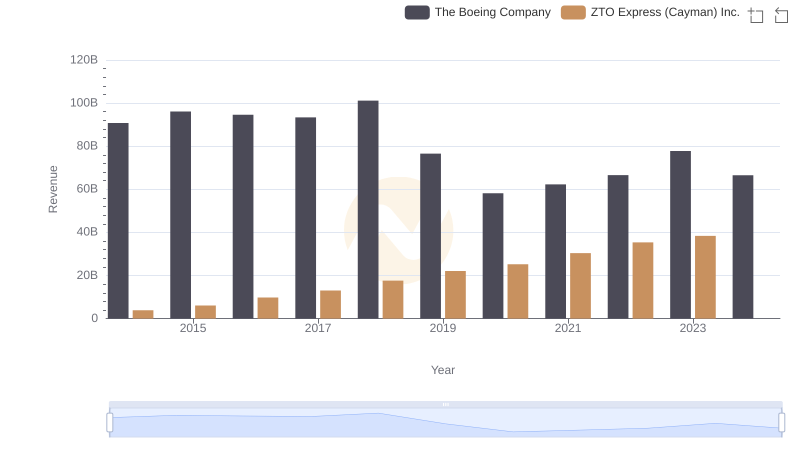
The Boeing Company or ZTO Express (Cayman) Inc.: Who Leads in Yearly Revenue?
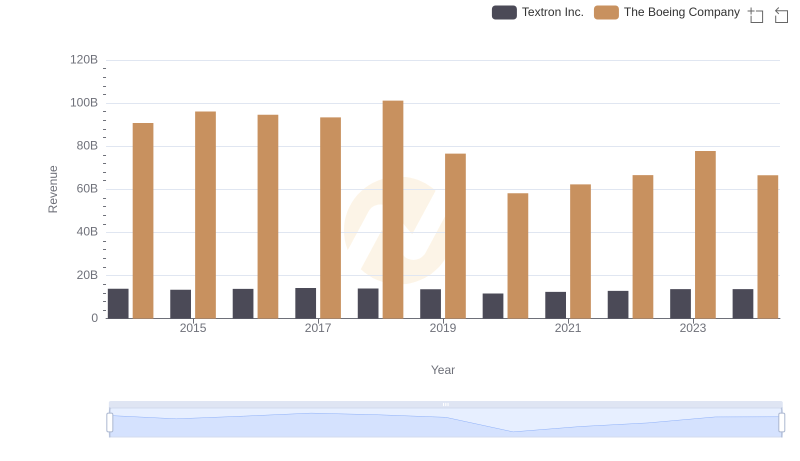
Annual Revenue Comparison: The Boeing Company vs Textron Inc.
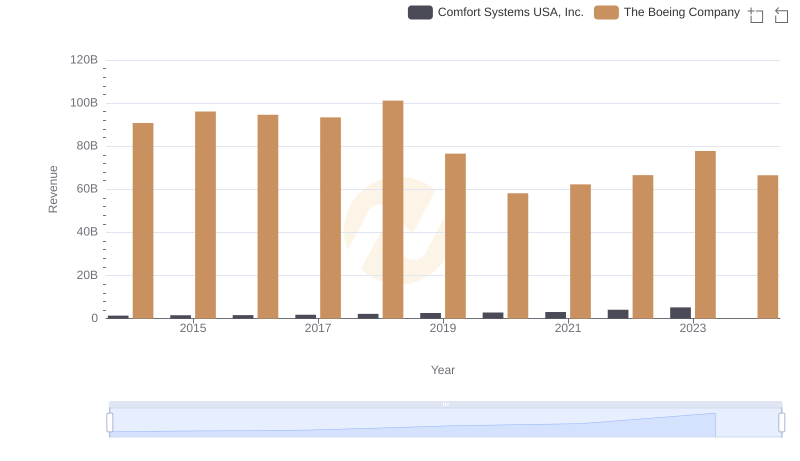
Breaking Down Revenue Trends: The Boeing Company vs Comfort Systems USA, Inc.

The Boeing Company or AECOM: Who Leads in Yearly Revenue?
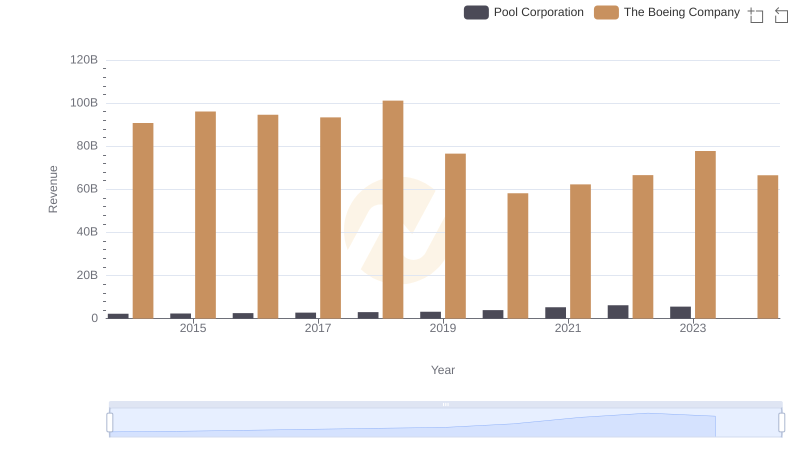
Breaking Down Revenue Trends: The Boeing Company vs Pool Corporation