| __timestamp | The Boeing Company | Xylem Inc. |
|---|---|---|
| Wednesday, January 1, 2014 | 90762000000 | 3916000000 |
| Thursday, January 1, 2015 | 96114000000 | 3653000000 |
| Friday, January 1, 2016 | 94571000000 | 3771000000 |
| Sunday, January 1, 2017 | 93392000000 | 4707000000 |
| Monday, January 1, 2018 | 101127000000 | 5207000000 |
| Tuesday, January 1, 2019 | 76559000000 | 5249000000 |
| Wednesday, January 1, 2020 | 58158000000 | 4876000000 |
| Friday, January 1, 2021 | 62286000000 | 5195000000 |
| Saturday, January 1, 2022 | 66608000000 | 5522000000 |
| Sunday, January 1, 2023 | 77794000000 | 7364000000 |
| Monday, January 1, 2024 | 66517000000 |
Infusing magic into the data realm
In the world of industrial titans, The Boeing Company and Xylem Inc. stand as fascinating contrasts. Over the past decade, Boeing's revenue has seen a rollercoaster ride, peaking in 2018 with a staggering 101 billion dollars, only to dip by nearly 43% in 2020 amidst global challenges. Meanwhile, Xylem Inc., a leader in water technology, has shown a steady climb, with its revenue growing by approximately 88% from 2014 to 2023.
Xylem's consistent growth, reaching a high of 7.4 billion dollars in 2023, underscores its resilience and strategic positioning in the market. Despite the absence of data for 2024, Xylem's trajectory suggests a promising future.
Boeing, on the other hand, is on a recovery path, with a 34% increase in revenue from 2020 to 2023, reflecting its efforts to regain its former glory.
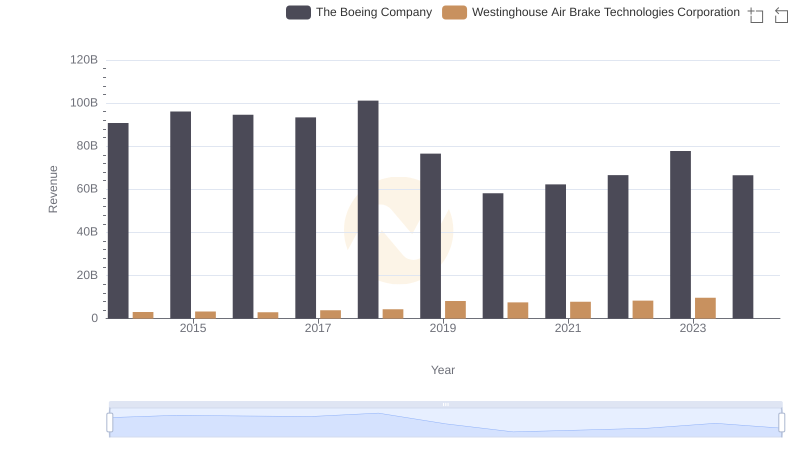
Revenue Showdown: The Boeing Company vs Westinghouse Air Brake Technologies Corporation
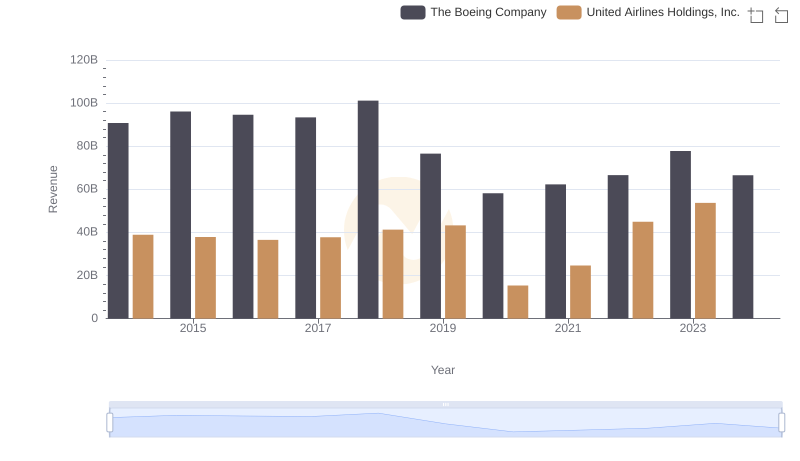
Comparing Revenue Performance: The Boeing Company or United Airlines Holdings, Inc.?
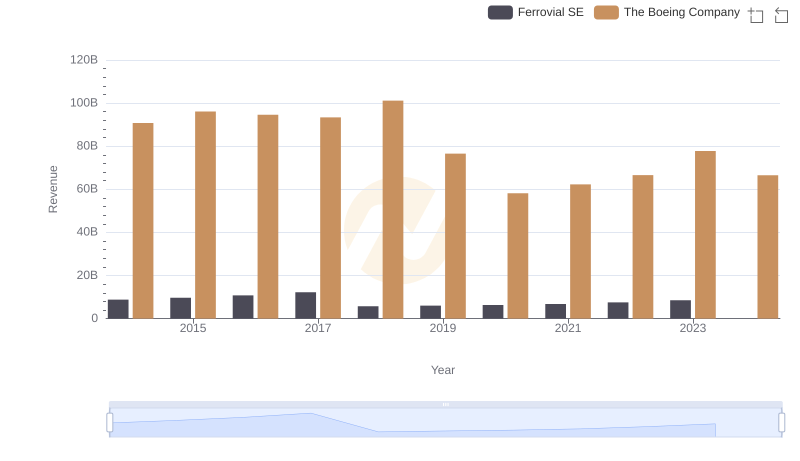
Breaking Down Revenue Trends: The Boeing Company vs Ferrovial SE
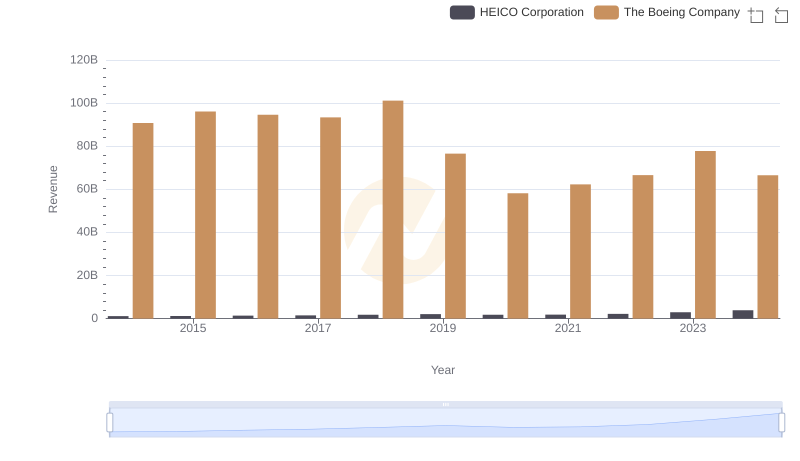
Revenue Showdown: The Boeing Company vs HEICO Corporation
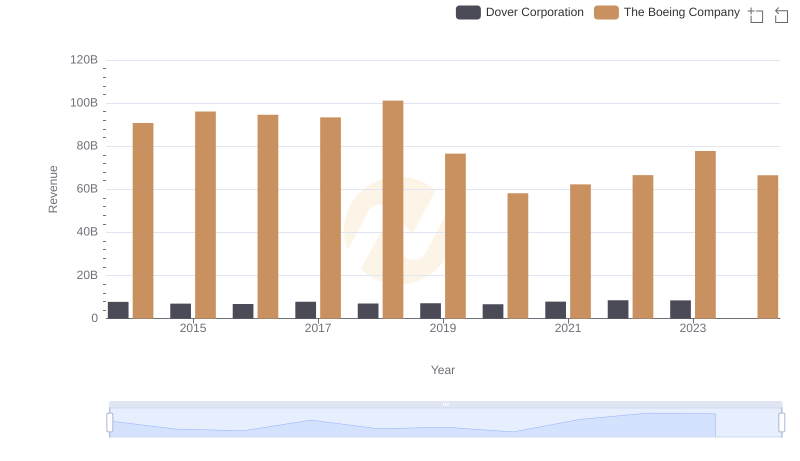
The Boeing Company and Dover Corporation: A Comprehensive Revenue Analysis
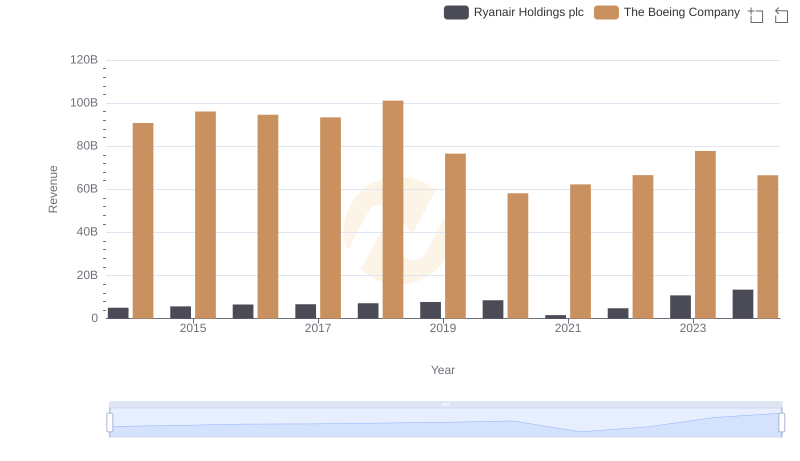
Who Generates More Revenue? The Boeing Company or Ryanair Holdings plc
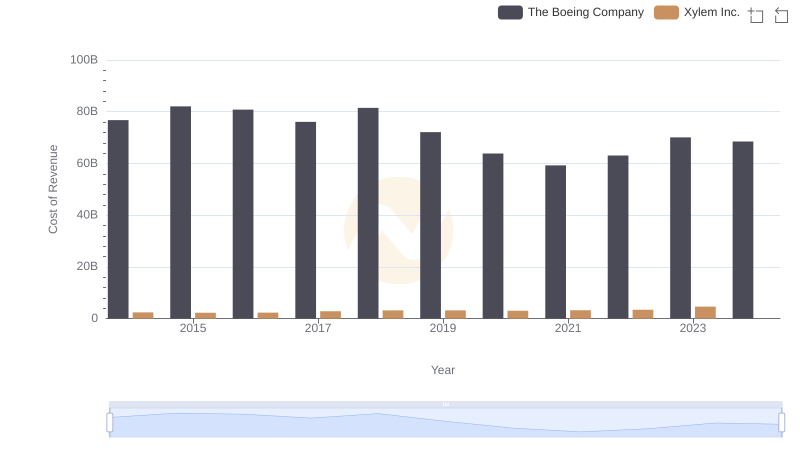
Cost of Revenue Trends: The Boeing Company vs Xylem Inc.
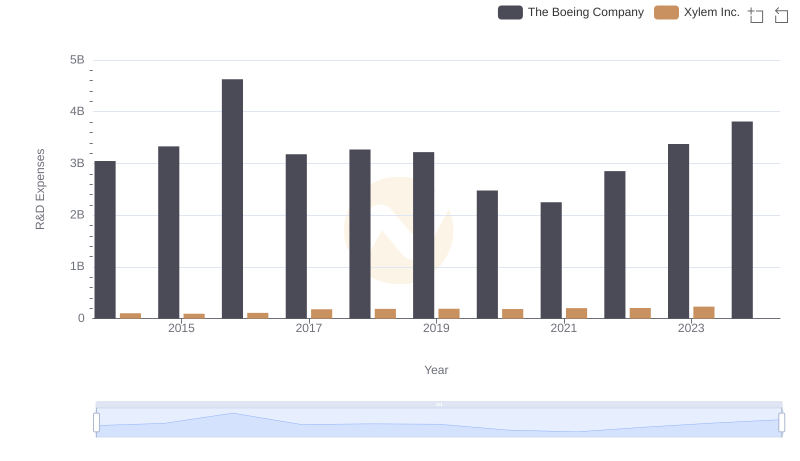
Comparing Innovation Spending: The Boeing Company and Xylem Inc.
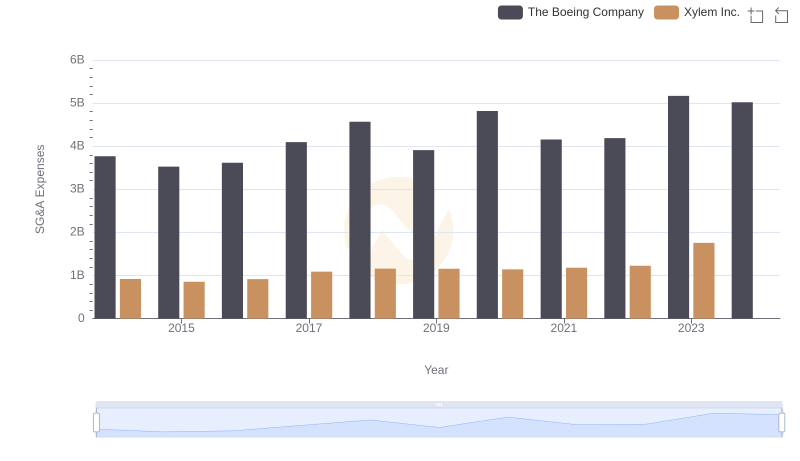
Who Optimizes SG&A Costs Better? The Boeing Company or Xylem Inc.