| __timestamp | Dover Corporation | The Boeing Company |
|---|---|---|
| Wednesday, January 1, 2014 | 7752728000 | 90762000000 |
| Thursday, January 1, 2015 | 6956311000 | 96114000000 |
| Friday, January 1, 2016 | 6794342000 | 94571000000 |
| Sunday, January 1, 2017 | 7830436000 | 93392000000 |
| Monday, January 1, 2018 | 6992118000 | 101127000000 |
| Tuesday, January 1, 2019 | 7136397000 | 76559000000 |
| Wednesday, January 1, 2020 | 6683760000 | 58158000000 |
| Friday, January 1, 2021 | 7907081000 | 62286000000 |
| Saturday, January 1, 2022 | 8508088000 | 66608000000 |
| Sunday, January 1, 2023 | 8438134000 | 77794000000 |
| Monday, January 1, 2024 | 7745909000 | 66517000000 |
Cracking the code
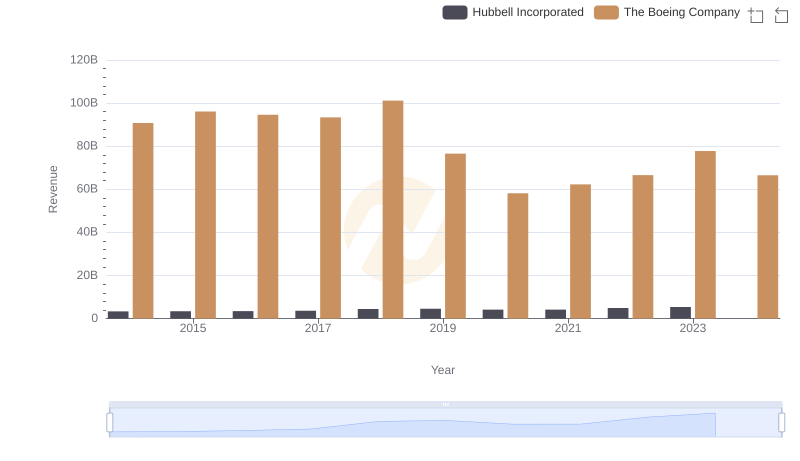
In the ever-evolving landscape of American industry, The Boeing Company and Dover Corporation stand as titans in their respective fields. From 2014 to 2023, these companies have navigated the turbulent waters of economic shifts and global challenges. Boeing, a leader in aerospace, saw its revenue peak in 2018, reaching a staggering 101 billion dollars, before experiencing a decline, notably during the pandemic in 2020, when revenues dropped by 42% from their peak. Meanwhile, Dover, a diversified global manufacturer, demonstrated resilience with a steady revenue increase, culminating in a 10% rise from 2014 to 2023. The data reveals a compelling narrative of adaptation and resilience, with Dover's consistent growth contrasting Boeing's more volatile trajectory. As we look to the future, the missing data for 2024 leaves us anticipating how these industrial giants will continue to adapt and thrive.
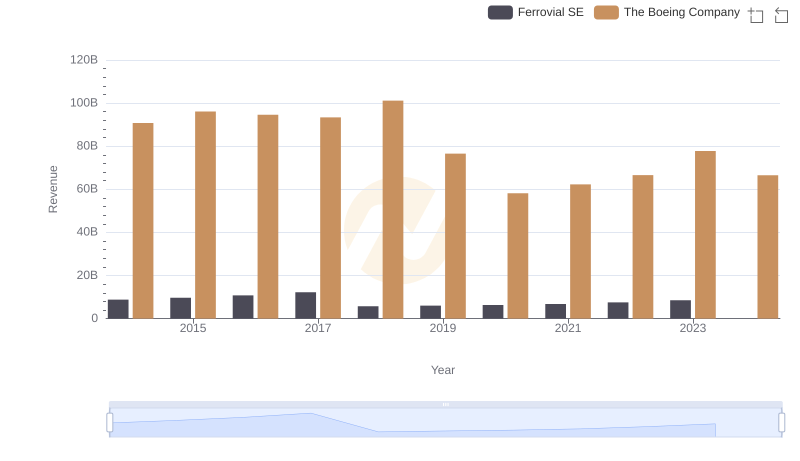
Breaking Down Revenue Trends: The Boeing Company vs Ferrovial SE
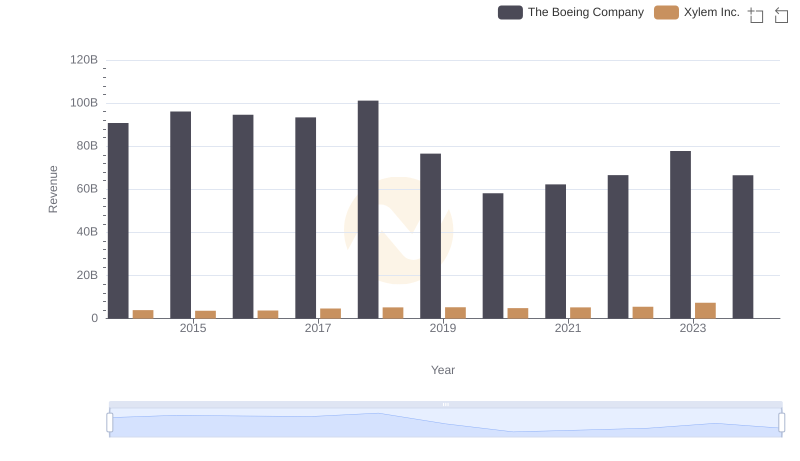
Annual Revenue Comparison: The Boeing Company vs Xylem Inc.
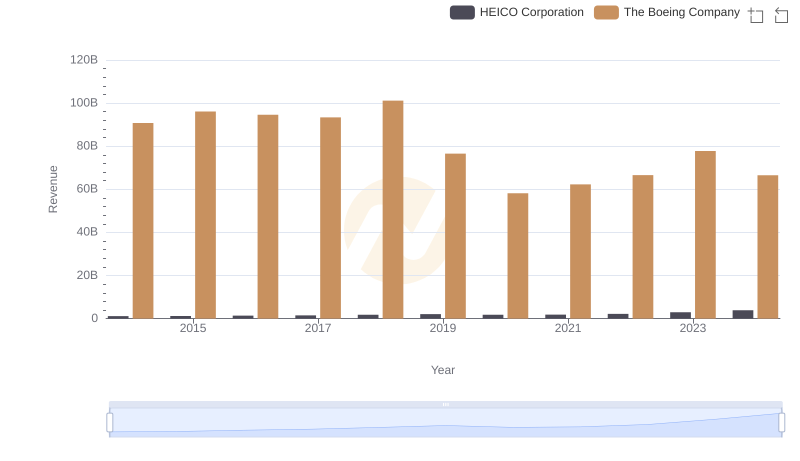
Revenue Showdown: The Boeing Company vs HEICO Corporation
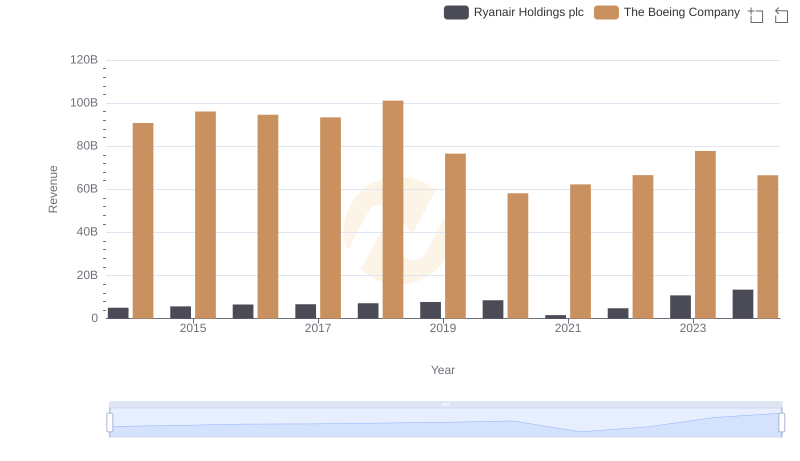
Who Generates More Revenue? The Boeing Company or Ryanair Holdings plc
Who Generates More Revenue? The Boeing Company or Hubbell Incorporated

Breaking Down Revenue Trends: The Boeing Company vs Lennox International Inc.