| __timestamp | The Boeing Company | United Airlines Holdings, Inc. |
|---|---|---|
| Wednesday, January 1, 2014 | 90762000000 | 38901000000 |
| Thursday, January 1, 2015 | 96114000000 | 37864000000 |
| Friday, January 1, 2016 | 94571000000 | 36556000000 |
| Sunday, January 1, 2017 | 93392000000 | 37736000000 |
| Monday, January 1, 2018 | 101127000000 | 41303000000 |
| Tuesday, January 1, 2019 | 76559000000 | 43259000000 |
| Wednesday, January 1, 2020 | 58158000000 | 15355000000 |
| Friday, January 1, 2021 | 62286000000 | 24634000000 |
| Saturday, January 1, 2022 | 66608000000 | 44955000000 |
| Sunday, January 1, 2023 | 77794000000 | 53717000000 |
| Monday, January 1, 2024 | 66517000000 | 57063000000 |
Infusing magic into the data realm
In the ever-evolving landscape of the aviation industry, revenue performance is a key indicator of a company's health and market position. This chart offers a fascinating glimpse into the financial trajectories of two industry titans: The Boeing Company and United Airlines Holdings, Inc., from 2014 to 2023.
Boeing's revenue peaked in 2018, reaching approximately $101 billion, before experiencing a significant dip in 2019 and 2020, likely due to the global pandemic and its impact on the aviation sector. Despite these challenges, Boeing's revenue rebounded by 2023, showing a 34% increase from its 2020 low.
United Airlines, on the other hand, saw a dramatic revenue drop in 2020, plummeting to around $15 billion. However, by 2023, United Airlines had not only recovered but also achieved a 250% increase in revenue, surpassing its 2014 figures.
This data underscores the resilience and adaptability of these aviation giants in the face of unprecedented challenges.

The Boeing Company vs Verisk Analytics, Inc.: Annual Revenue Growth Compared
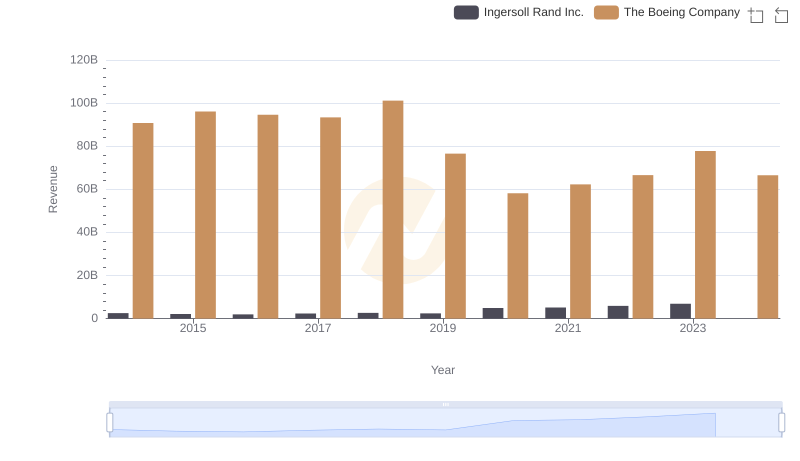
Who Generates More Revenue? The Boeing Company or Ingersoll Rand Inc.
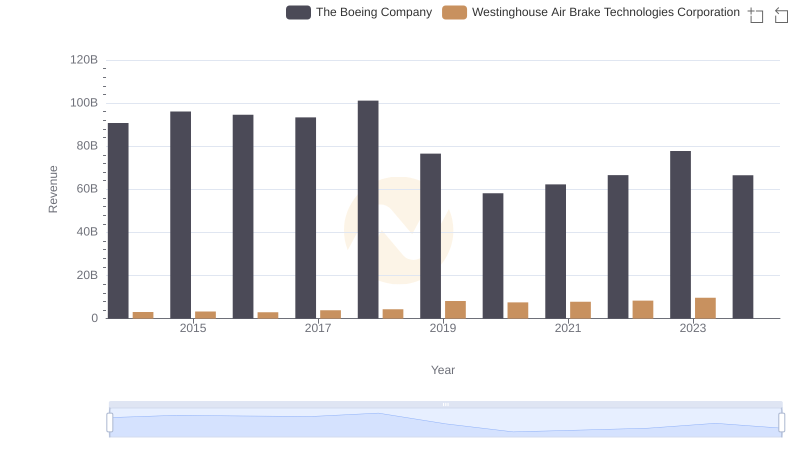
Revenue Showdown: The Boeing Company vs Westinghouse Air Brake Technologies Corporation
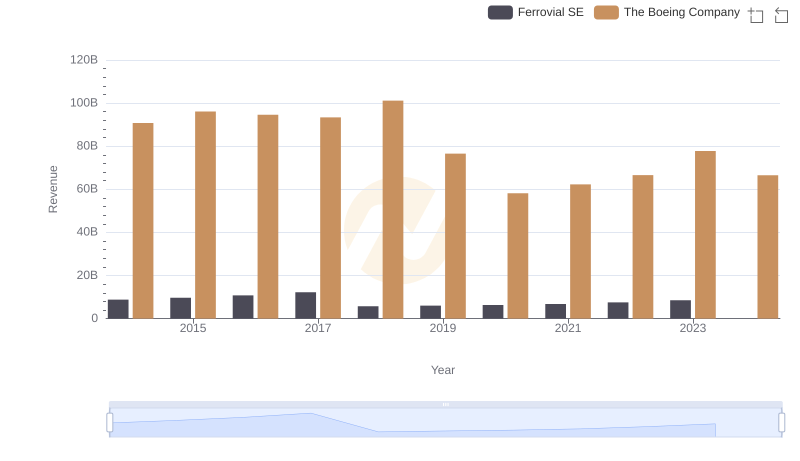
Breaking Down Revenue Trends: The Boeing Company vs Ferrovial SE
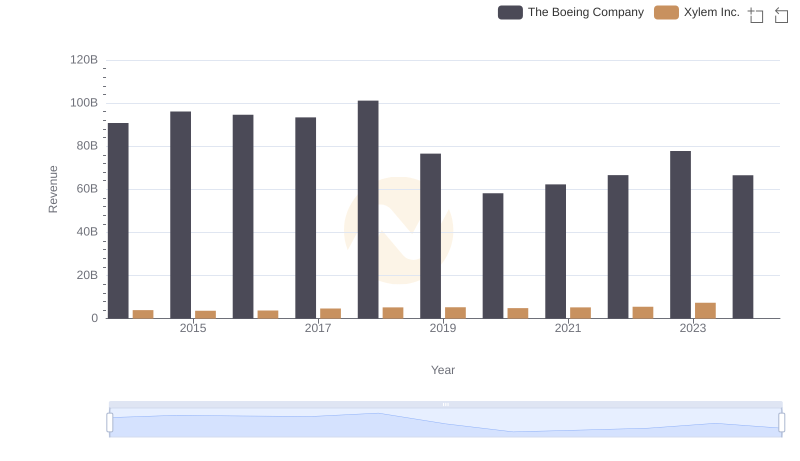
Annual Revenue Comparison: The Boeing Company vs Xylem Inc.
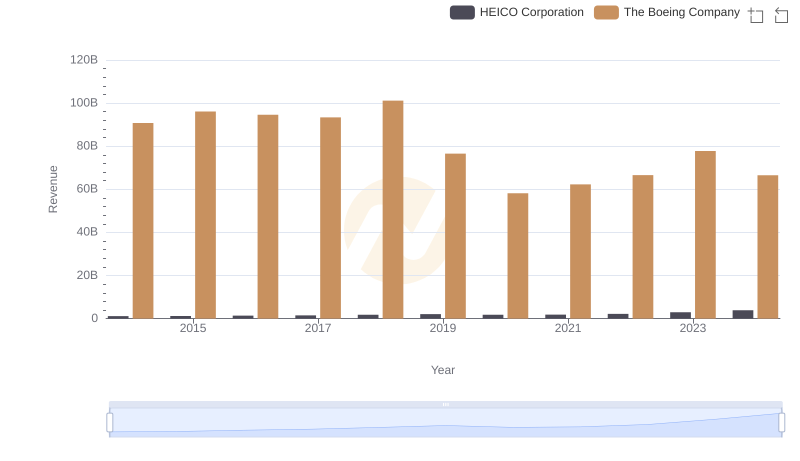
Revenue Showdown: The Boeing Company vs HEICO Corporation