| __timestamp | CNH Industrial N.V. | Old Dominion Freight Line, Inc. |
|---|---|---|
| Wednesday, January 1, 2014 | 32555000000 | 2787897000 |
| Thursday, January 1, 2015 | 25912000000 | 2972442000 |
| Friday, January 1, 2016 | 24872000000 | 2991517000 |
| Sunday, January 1, 2017 | 27361000000 | 3358112000 |
| Monday, January 1, 2018 | 29706000000 | 4043695000 |
| Tuesday, January 1, 2019 | 28079000000 | 4109111000 |
| Wednesday, January 1, 2020 | 26032000000 | 4015129000 |
| Friday, January 1, 2021 | 33428000000 | 5256328000 |
| Saturday, January 1, 2022 | 23551000000 | 6260077000 |
| Sunday, January 1, 2023 | 24694000000 | 5866152000 |
Data in motion
In the ever-evolving landscape of global logistics and industrial machinery, two titans stand out: Old Dominion Freight Line, Inc. and CNH Industrial N.V. Over the past decade, these companies have showcased contrasting revenue trajectories. From 2014 to 2023, CNH Industrial's revenue saw a decline of approximately 24%, dropping from its peak in 2014. In contrast, Old Dominion Freight Line experienced a robust growth of nearly 111% during the same period, highlighting its resilience and strategic prowess.
This comparison underscores the dynamic nature of these industries and the strategic decisions that drive success.
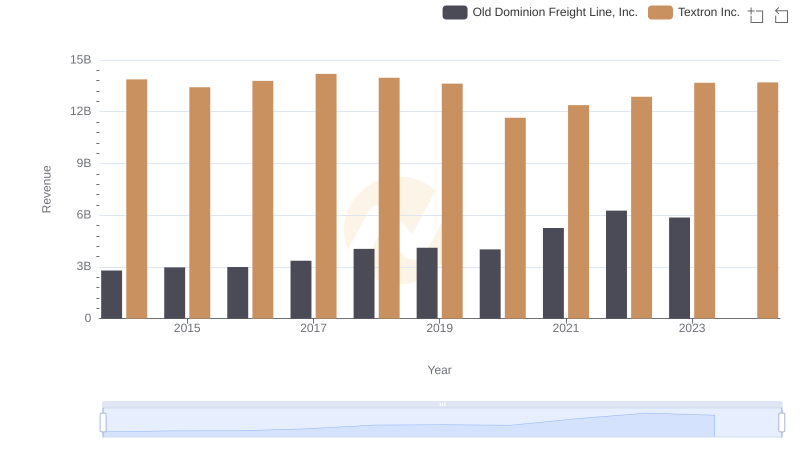
Comparing Revenue Performance: Old Dominion Freight Line, Inc. or Textron Inc.?
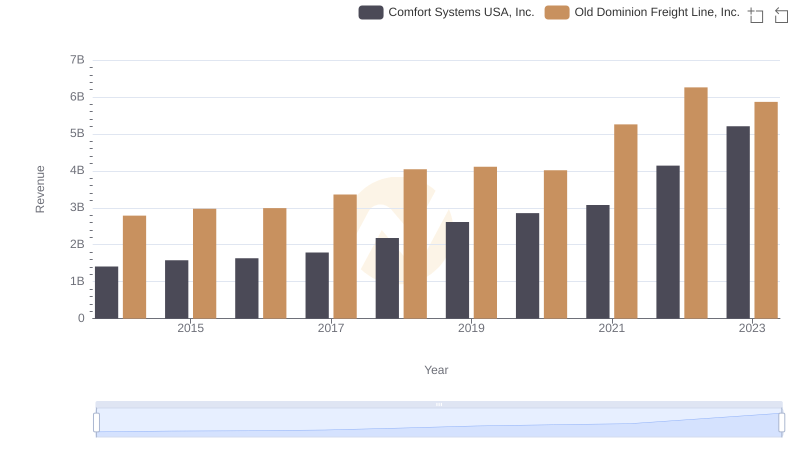
Breaking Down Revenue Trends: Old Dominion Freight Line, Inc. vs Comfort Systems USA, Inc.
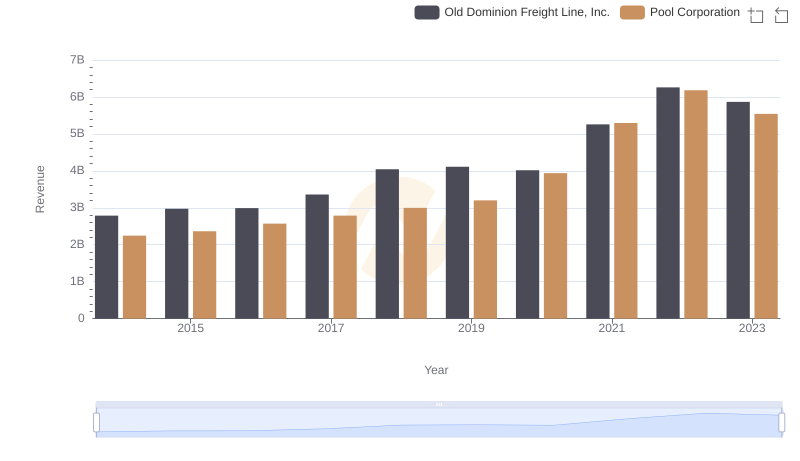
Breaking Down Revenue Trends: Old Dominion Freight Line, Inc. vs Pool Corporation
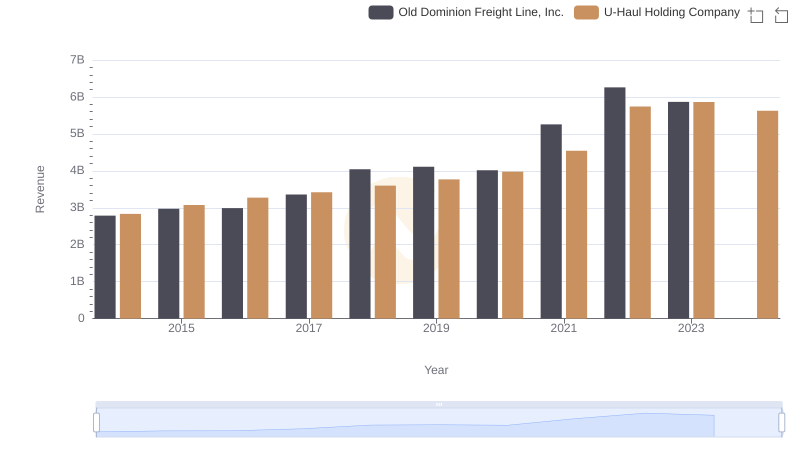
Old Dominion Freight Line, Inc. or U-Haul Holding Company: Who Leads in Yearly Revenue?
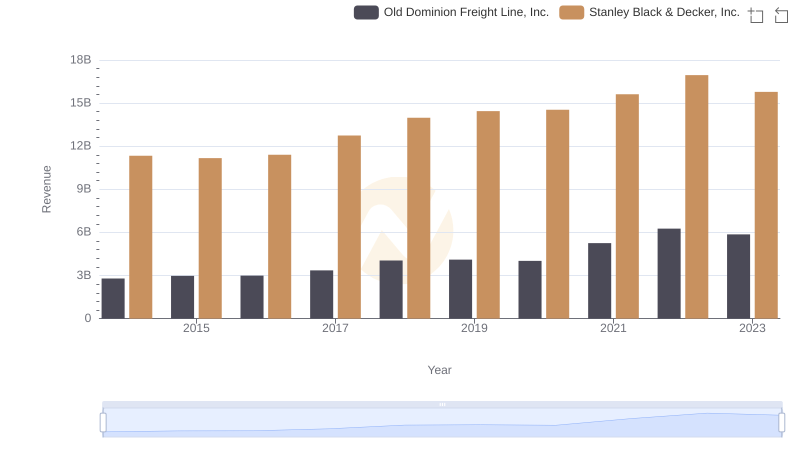
Old Dominion Freight Line, Inc. vs Stanley Black & Decker, Inc.: Annual Revenue Growth Compared
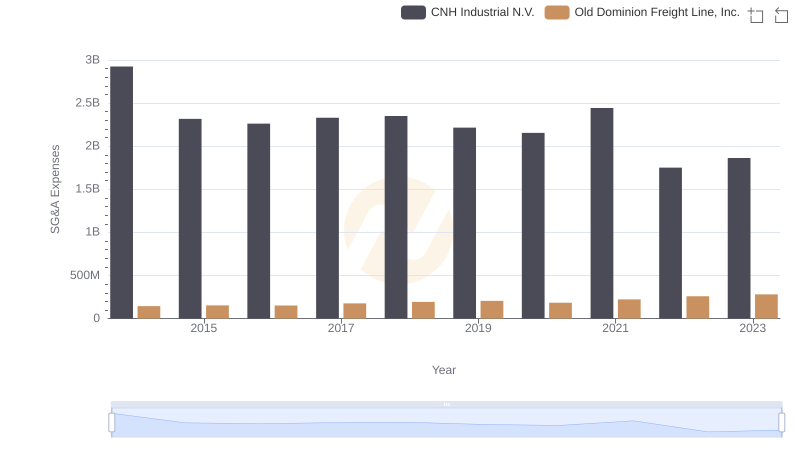
Who Optimizes SG&A Costs Better? Old Dominion Freight Line, Inc. or CNH Industrial N.V.