| __timestamp | Avery Dennison Corporation | CSX Corporation |
|---|---|---|
| Wednesday, January 1, 2014 | 4679100000 | 9056000000 |
| Thursday, January 1, 2015 | 4321100000 | 8227000000 |
| Friday, January 1, 2016 | 4386800000 | 7680000000 |
| Sunday, January 1, 2017 | 4801600000 | 7635000000 |
| Monday, January 1, 2018 | 5243500000 | 7477000000 |
| Tuesday, January 1, 2019 | 5166000000 | 7063000000 |
| Wednesday, January 1, 2020 | 5048200000 | 6221000000 |
| Friday, January 1, 2021 | 6095500000 | 7382000000 |
| Saturday, January 1, 2022 | 6635100000 | 9068000000 |
| Sunday, January 1, 2023 | 6086800000 | 9130000000 |
| Monday, January 1, 2024 | 6225000000 |
In pursuit of knowledge
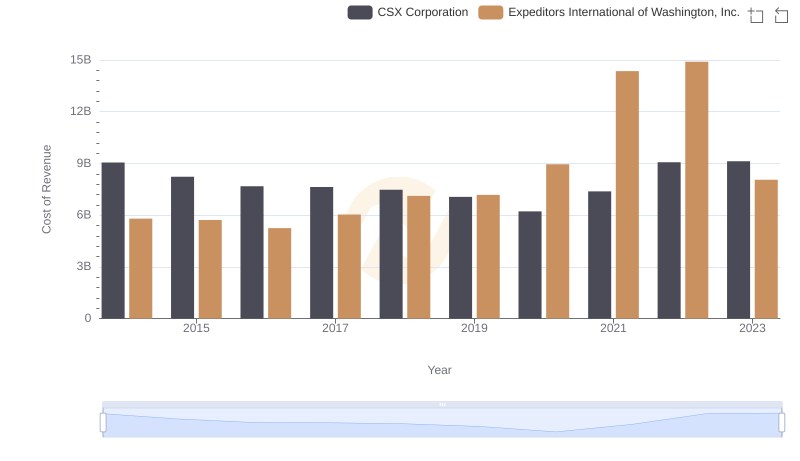
In the ever-evolving landscape of American industry, CSX Corporation and Avery Dennison Corporation stand as titans in their respective fields. Over the past decade, these companies have navigated the complexities of cost management with varying strategies and outcomes.
From 2014 to 2023, Avery Dennison's cost of revenue has seen a steady increase, peaking in 2022 with a 54% rise from its 2015 low. This reflects the company's strategic investments in innovation and sustainability. Meanwhile, CSX Corporation experienced a more volatile journey, with costs dipping by 31% from 2014 to 2020, before rebounding sharply by 47% in 2023. This fluctuation highlights the challenges faced by the transportation sector, including economic shifts and regulatory changes.
Understanding these trends offers valuable insights into the operational efficiencies and market dynamics that shape these industry leaders. As we look to the future, the ability to adapt and innovate will be crucial for maintaining competitive advantage.