| __timestamp | Axon Enterprise, Inc. | TFI International Inc. |
|---|---|---|
| Wednesday, January 1, 2014 | 164525000 | 3199928501 |
| Thursday, January 1, 2015 | 197892000 | 2904026835 |
| Friday, January 1, 2016 | 268245000 | 2994723606 |
| Sunday, January 1, 2017 | 343798000 | 3770194035 |
| Monday, January 1, 2018 | 420068000 | 3761450188 |
| Tuesday, January 1, 2019 | 530860000 | 3964619871 |
| Wednesday, January 1, 2020 | 681003000 | 3781134000 |
| Friday, January 1, 2021 | 863381000 | 7220429000 |
| Saturday, January 1, 2022 | 1189935000 | 8812491000 |
| Sunday, January 1, 2023 | 1563391000 | 7521167000 |
Data in motion
In the ever-evolving landscape of business, understanding revenue trends is crucial. From 2014 to 2023, Axon Enterprise, Inc. and TFI International Inc. have shown remarkable growth trajectories. Axon, a leader in public safety technology, has seen its revenue surge by over 850%, from approximately $165 million in 2014 to $1.56 billion in 2023. This growth reflects a compound annual growth rate (CAGR) of around 30%, underscoring its expanding market influence.
Meanwhile, TFI International, a giant in the transportation and logistics sector, has experienced a steady revenue increase of about 135% over the same period. Starting at nearly $3.2 billion in 2014, TFI's revenue peaked at $8.81 billion in 2022, before slightly declining to $7.52 billion in 2023. This trend highlights the company's resilience and adaptability in a competitive industry.
These insights offer a compelling narrative of two companies navigating their respective markets with distinct strategies and outcomes.
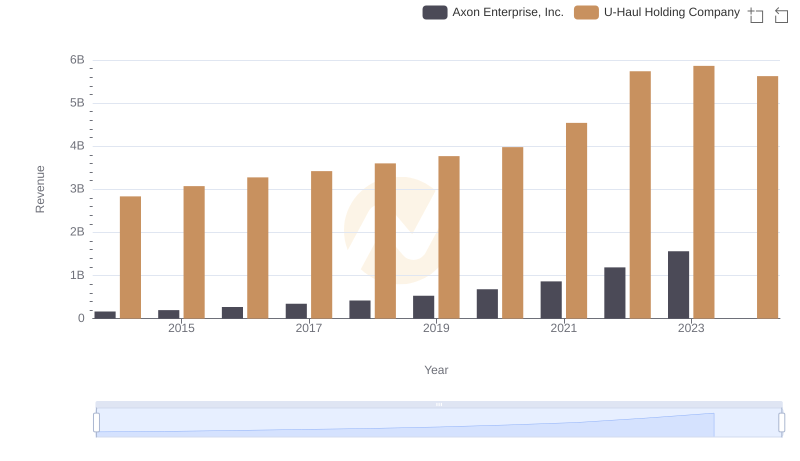
Who Generates More Revenue? Axon Enterprise, Inc. or U-Haul Holding Company
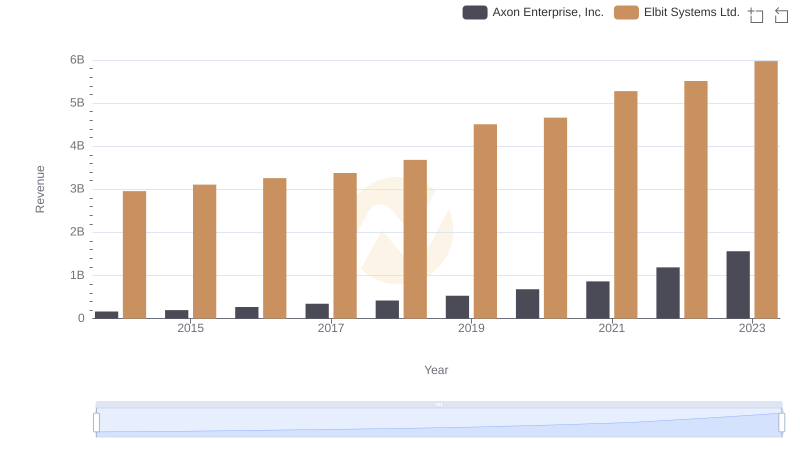
Revenue Insights: Axon Enterprise, Inc. and Elbit Systems Ltd. Performance Compared
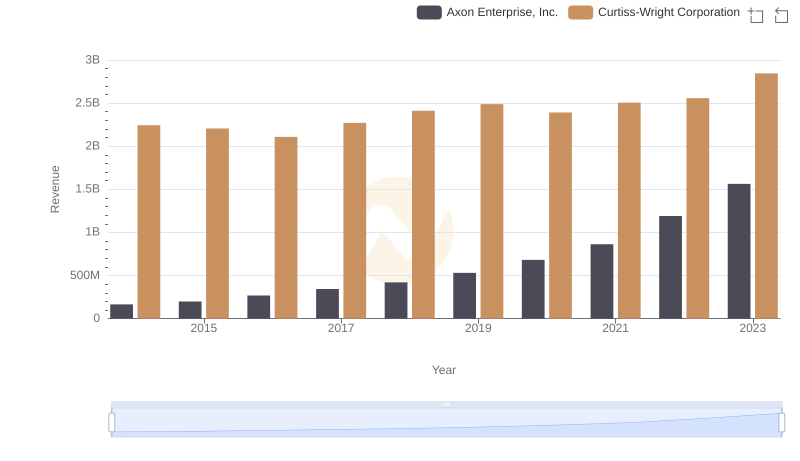
Annual Revenue Comparison: Axon Enterprise, Inc. vs Curtiss-Wright Corporation
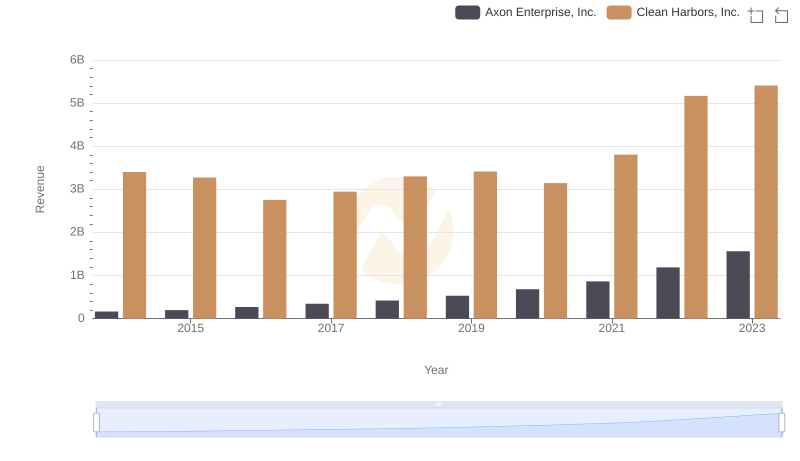
Comparing Revenue Performance: Axon Enterprise, Inc. or Clean Harbors, Inc.?
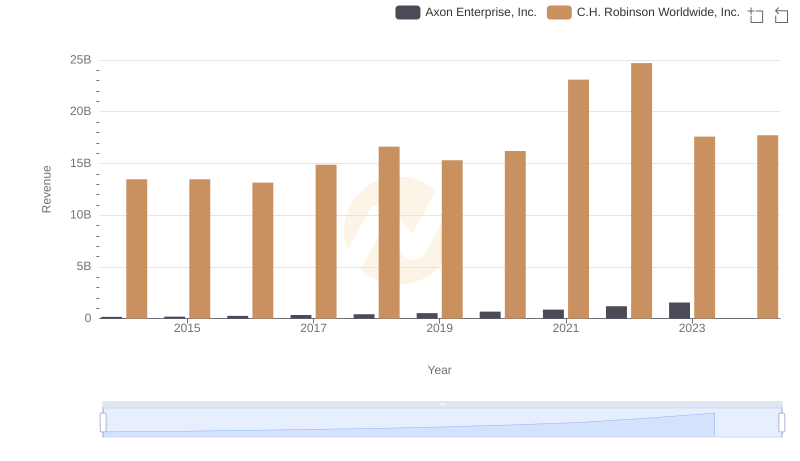
Annual Revenue Comparison: Axon Enterprise, Inc. vs C.H. Robinson Worldwide, Inc.
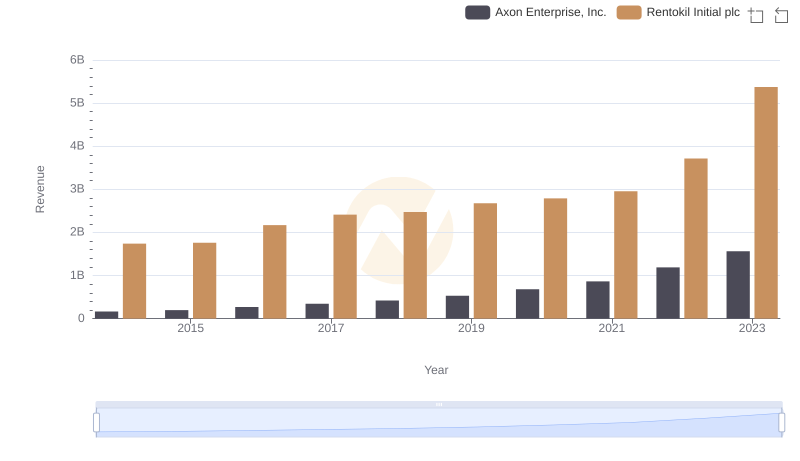
Who Generates More Revenue? Axon Enterprise, Inc. or Rentokil Initial plc
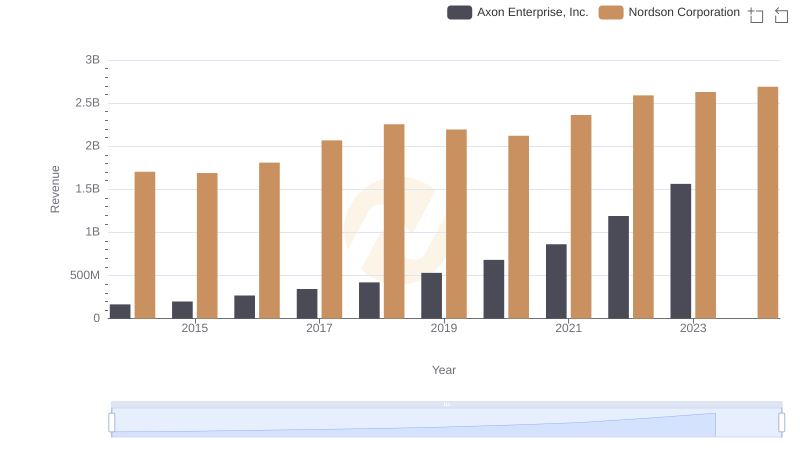
Axon Enterprise, Inc. vs Nordson Corporation: Annual Revenue Growth Compared
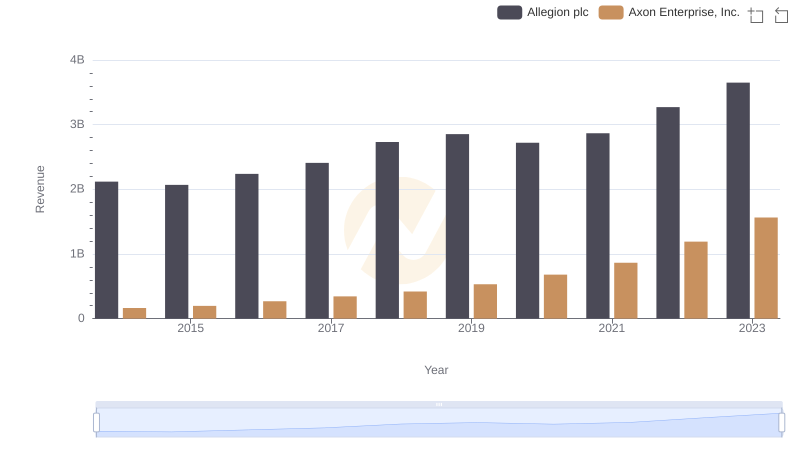
Axon Enterprise, Inc. vs Allegion plc: Annual Revenue Growth Compared
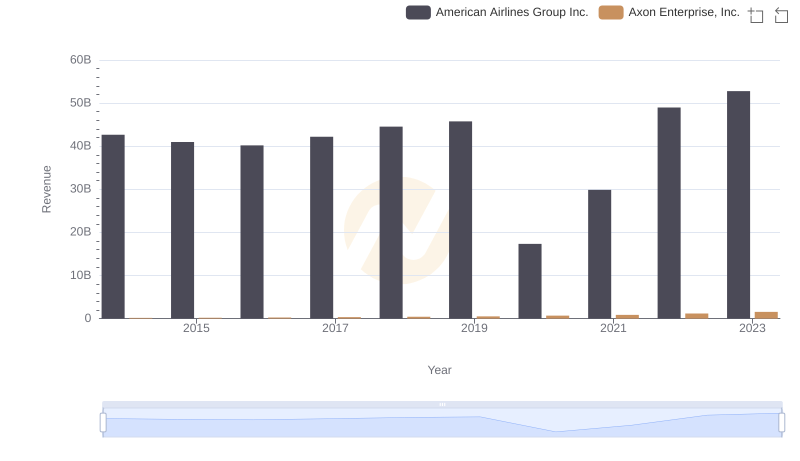
Axon Enterprise, Inc. or American Airlines Group Inc.: Who Leads in Yearly Revenue?
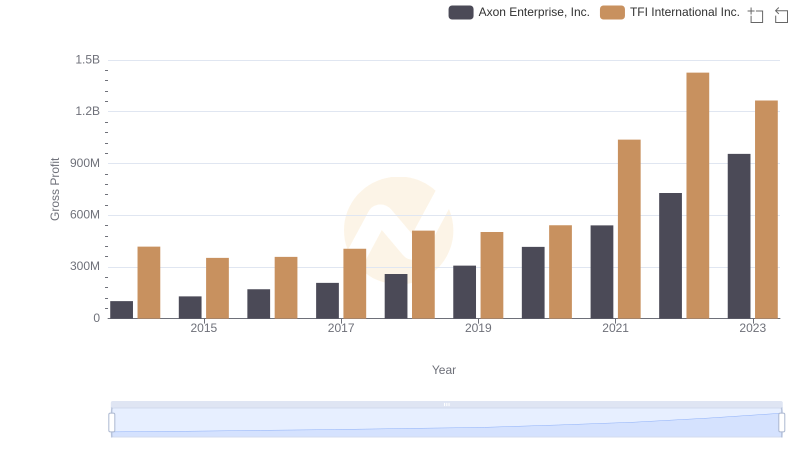
Key Insights on Gross Profit: Axon Enterprise, Inc. vs TFI International Inc.