| __timestamp | Howmet Aerospace Inc. | Stanley Black & Decker, Inc. |
|---|---|---|
| Wednesday, January 1, 2014 | 12542000000 | 11338600000 |
| Thursday, January 1, 2015 | 12413000000 | 11171800000 |
| Friday, January 1, 2016 | 12394000000 | 11406900000 |
| Sunday, January 1, 2017 | 12960000000 | 12747200000 |
| Monday, January 1, 2018 | 14014000000 | 13982400000 |
| Tuesday, January 1, 2019 | 14192000000 | 14442200000 |
| Wednesday, January 1, 2020 | 5259000000 | 14534600000 |
| Friday, January 1, 2021 | 4972000000 | 15617200000 |
| Saturday, January 1, 2022 | 5663000000 | 16947400000 |
| Sunday, January 1, 2023 | 6640000000 | 15781100000 |
| Monday, January 1, 2024 | 7430000000 | 15365700000 |
Infusing magic into the data realm
In the ever-evolving landscape of industrial giants, Howmet Aerospace Inc. and Stanley Black & Decker, Inc. have carved distinct paths over the past decade. From 2014 to 2023, Howmet Aerospace's revenue journey reflects a significant transformation. Initially, it maintained a steady revenue stream, peaking in 2019. However, the pandemic year of 2020 marked a sharp decline, with revenues dropping by over 60%. In contrast, Stanley Black & Decker demonstrated resilience, with a consistent upward trajectory, achieving a 40% increase in revenue by 2022 compared to 2014.
This comparison highlights the contrasting strategies and market dynamics faced by these two industry leaders. While Howmet Aerospace is on a recovery path, Stanley Black & Decker's robust growth underscores its adaptability and market strength. As we look to the future, these trends offer valuable insights into the industrial sector's resilience and adaptability.
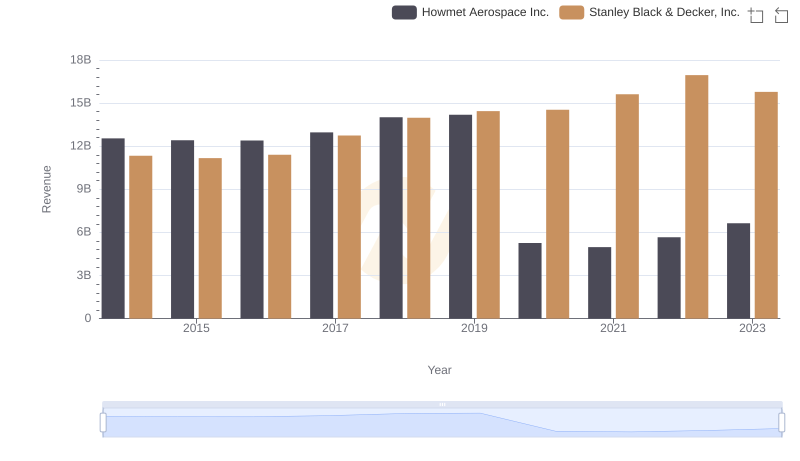
Howmet Aerospace Inc. vs Stanley Black & Decker, Inc.: Examining Key Revenue Metrics

Cost of Revenue Comparison: Howmet Aerospace Inc. vs Stanley Black & Decker, Inc.

Howmet Aerospace Inc. and Stanley Black & Decker, Inc.: A Detailed Gross Profit Analysis
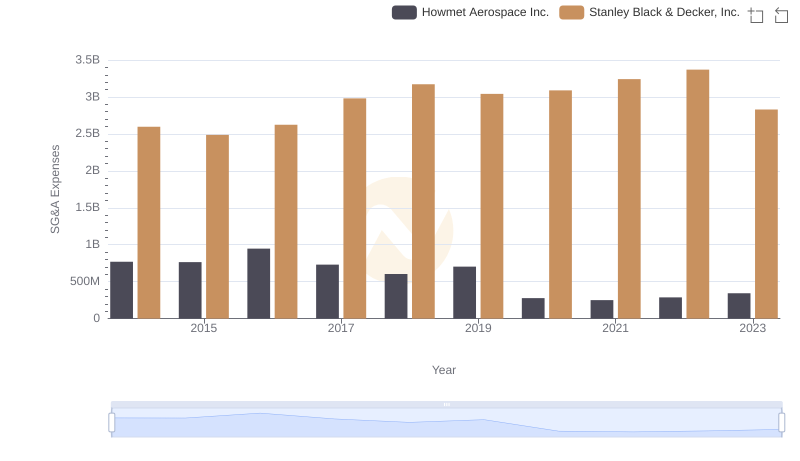
Breaking Down SG&A Expenses: Howmet Aerospace Inc. vs Stanley Black & Decker, Inc.

A Side-by-Side Analysis of EBITDA: Howmet Aerospace Inc. and Stanley Black & Decker, Inc.
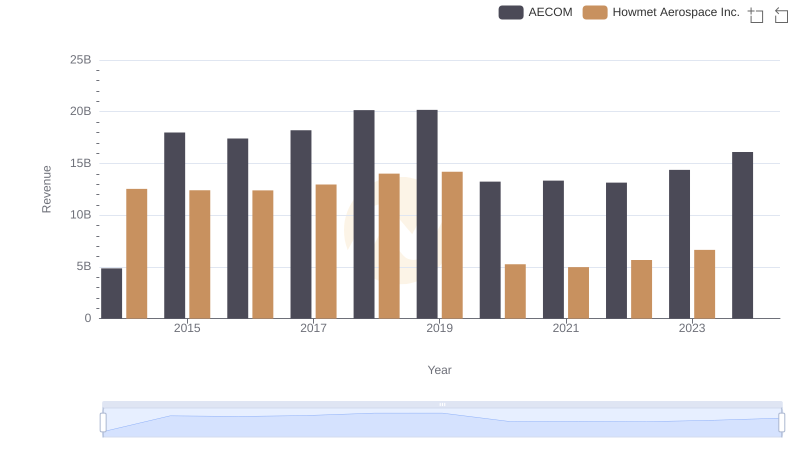
Howmet Aerospace Inc. vs AECOM: Examining Key Revenue Metrics
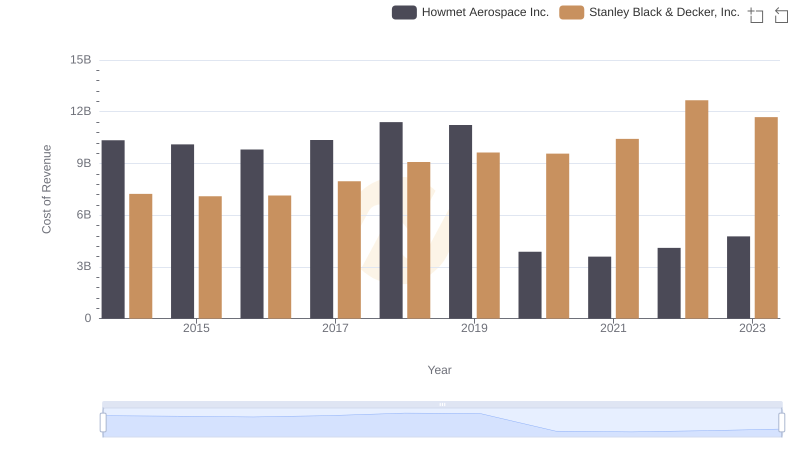
Cost of Revenue Comparison: Howmet Aerospace Inc. vs Stanley Black & Decker, Inc.
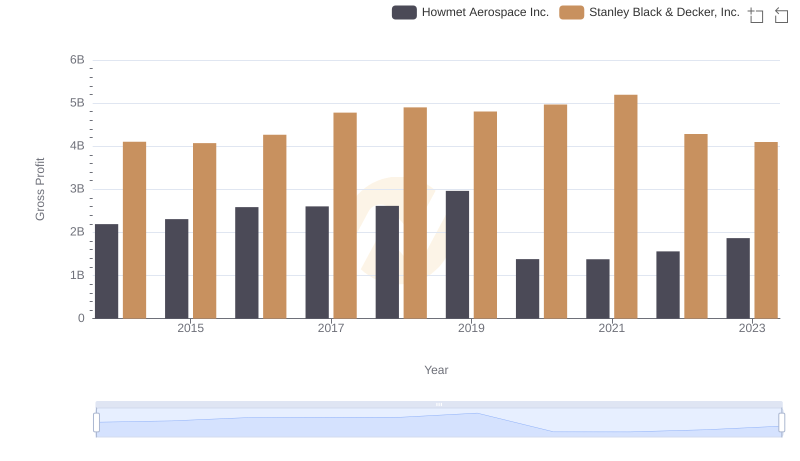
Who Generates Higher Gross Profit? Howmet Aerospace Inc. or Stanley Black & Decker, Inc.
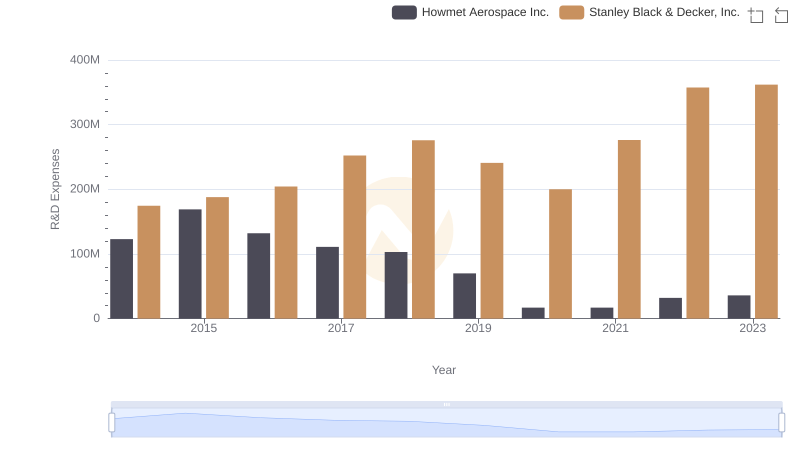
Howmet Aerospace Inc. or Stanley Black & Decker, Inc.: Who Invests More in Innovation?
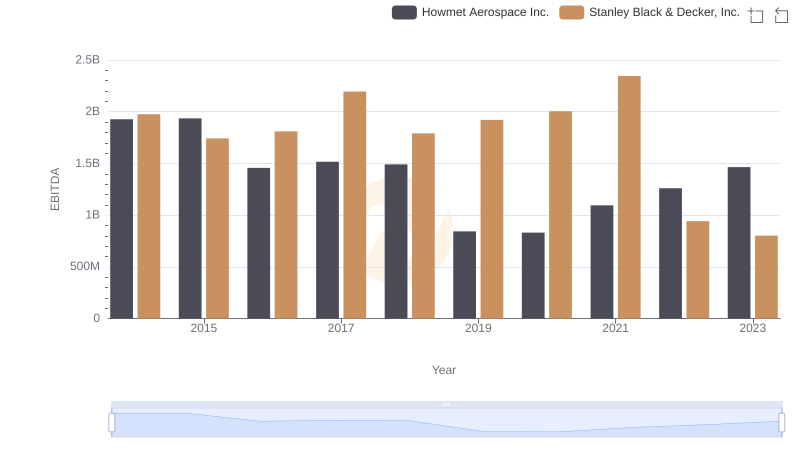
Howmet Aerospace Inc. and Stanley Black & Decker, Inc.: A Detailed Examination of EBITDA Performance