| __timestamp | Howmet Aerospace Inc. | Stanley Black & Decker, Inc. |
|---|---|---|
| Wednesday, January 1, 2014 | 2193000000 | 4102700000 |
| Thursday, January 1, 2015 | 2309000000 | 4072000000 |
| Friday, January 1, 2016 | 2588000000 | 4267200000 |
| Sunday, January 1, 2017 | 2603000000 | 4778000000 |
| Monday, January 1, 2018 | 2617000000 | 4901900000 |
| Tuesday, January 1, 2019 | 2965000000 | 4805500000 |
| Wednesday, January 1, 2020 | 1381000000 | 4967900000 |
| Friday, January 1, 2021 | 1376000000 | 5194200000 |
| Saturday, January 1, 2022 | 1560000000 | 4284100000 |
| Sunday, January 1, 2023 | 1867000000 | 4098000000 |
| Monday, January 1, 2024 | 2311000000 | 4514400000 |
Infusing magic into the data realm
In the ever-evolving landscape of industrial giants, Howmet Aerospace Inc. and Stanley Black & Decker, Inc. have carved distinct paths over the past decade. From 2014 to 2023, Howmet Aerospace's gross profit saw a significant dip, plummeting by nearly 37% from its peak in 2019. This decline was most pronounced in 2020, coinciding with global disruptions. Meanwhile, Stanley Black & Decker maintained a relatively stable trajectory, with gross profits peaking in 2021 before experiencing a modest decline of about 21% by 2023.
This analysis highlights the resilience and challenges faced by these industry leaders. Howmet's recovery efforts post-2020 are noteworthy, while Stanley's consistent performance underscores its robust market position. As we look to the future, these trends offer valuable insights into the strategic maneuvers of these titans.
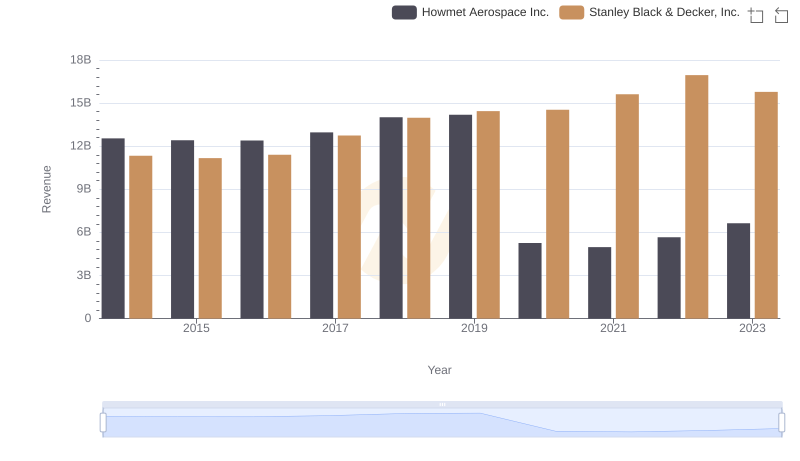
Howmet Aerospace Inc. vs Stanley Black & Decker, Inc.: Examining Key Revenue Metrics

Cost of Revenue Comparison: Howmet Aerospace Inc. vs Stanley Black & Decker, Inc.
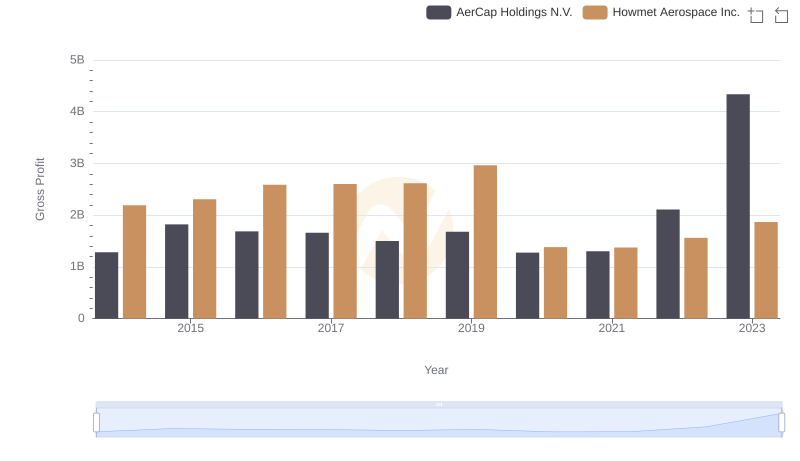
Gross Profit Analysis: Comparing Howmet Aerospace Inc. and AerCap Holdings N.V.
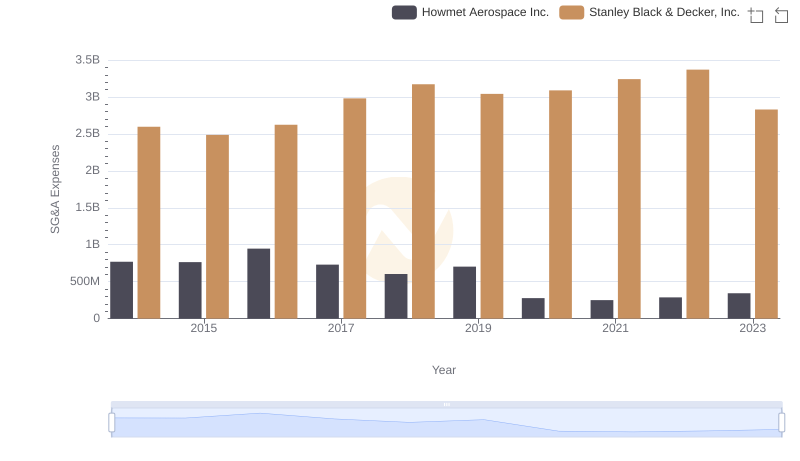
Breaking Down SG&A Expenses: Howmet Aerospace Inc. vs Stanley Black & Decker, Inc.

A Side-by-Side Analysis of EBITDA: Howmet Aerospace Inc. and Stanley Black & Decker, Inc.

Annual Revenue Comparison: Howmet Aerospace Inc. vs Stanley Black & Decker, Inc.
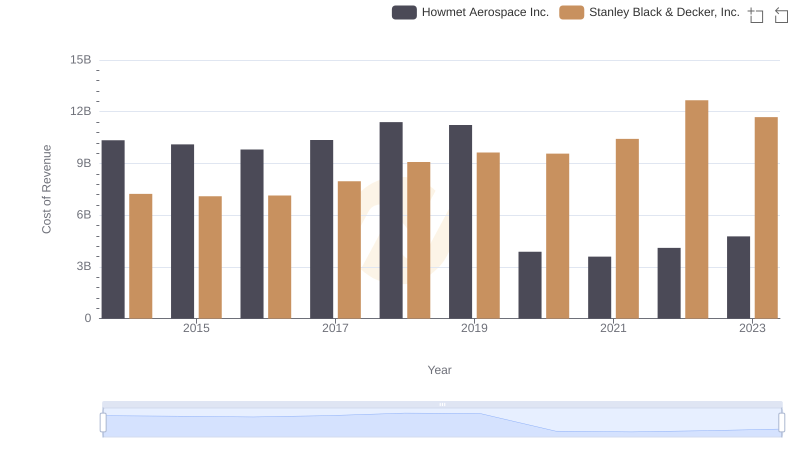
Cost of Revenue Comparison: Howmet Aerospace Inc. vs Stanley Black & Decker, Inc.
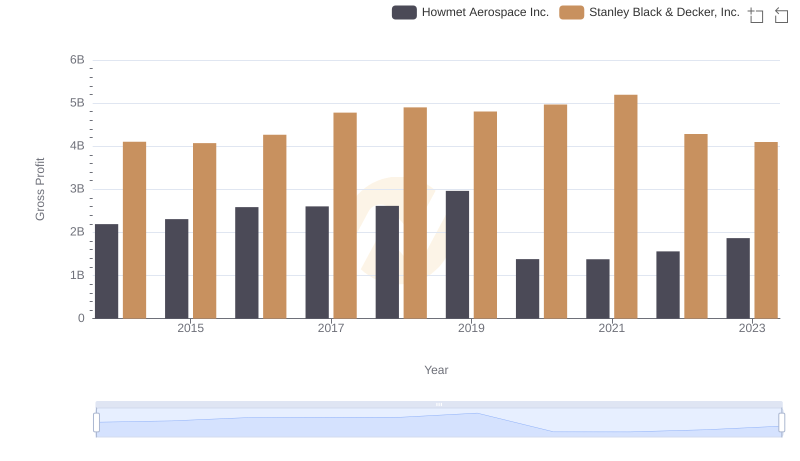
Who Generates Higher Gross Profit? Howmet Aerospace Inc. or Stanley Black & Decker, Inc.
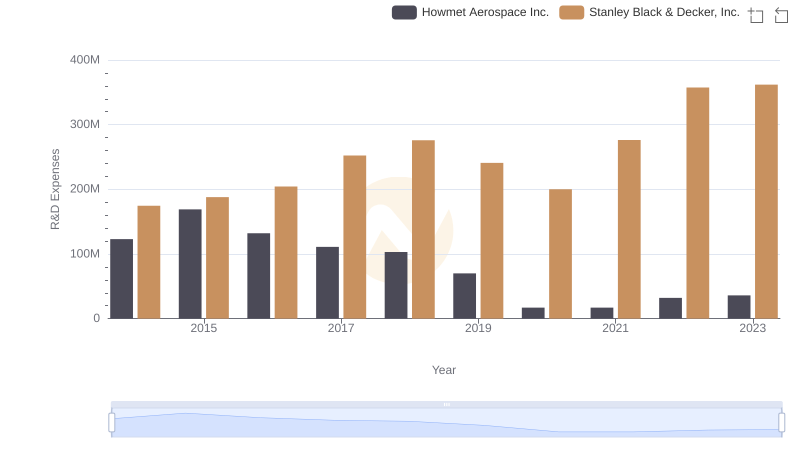
Howmet Aerospace Inc. or Stanley Black & Decker, Inc.: Who Invests More in Innovation?
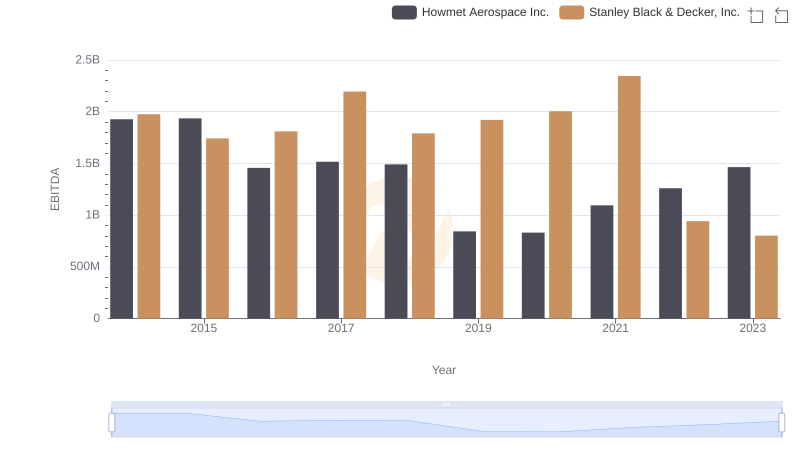
Howmet Aerospace Inc. and Stanley Black & Decker, Inc.: A Detailed Examination of EBITDA Performance