| __timestamp | AECOM | Howmet Aerospace Inc. |
|---|---|---|
| Wednesday, January 1, 2014 | 4855627000 | 12542000000 |
| Thursday, January 1, 2015 | 17989880000 | 12413000000 |
| Friday, January 1, 2016 | 17410825000 | 12394000000 |
| Sunday, January 1, 2017 | 18203402000 | 12960000000 |
| Monday, January 1, 2018 | 20155512000 | 14014000000 |
| Tuesday, January 1, 2019 | 20173329000 | 14192000000 |
| Wednesday, January 1, 2020 | 13239976000 | 5259000000 |
| Friday, January 1, 2021 | 13340852000 | 4972000000 |
| Saturday, January 1, 2022 | 13148182000 | 5663000000 |
| Sunday, January 1, 2023 | 14378461000 | 6640000000 |
| Monday, January 1, 2024 | 16105498000 | 7430000000 |
Unleashing the power of data
In the ever-evolving landscape of aerospace and infrastructure, Howmet Aerospace Inc. and AECOM stand as titans. Over the past decade, these companies have showcased contrasting revenue trajectories. From 2014 to 2019, AECOM's revenue surged by approximately 315%, peaking in 2019. However, the pandemic year of 2020 marked a downturn, with revenues dropping by 34% from their peak. Meanwhile, Howmet Aerospace Inc. experienced a steady climb until 2019, with a notable dip in 2020, reflecting a 63% decrease from its 2019 high. By 2023, AECOM began to recover, showing a 9% increase from 2022, while Howmet's recovery was more modest, with a 16% rise from its 2021 low. The data for 2024 remains incomplete, leaving room for speculation on future trends. This analysis underscores the resilience and adaptability of these industry leaders in the face of global challenges.
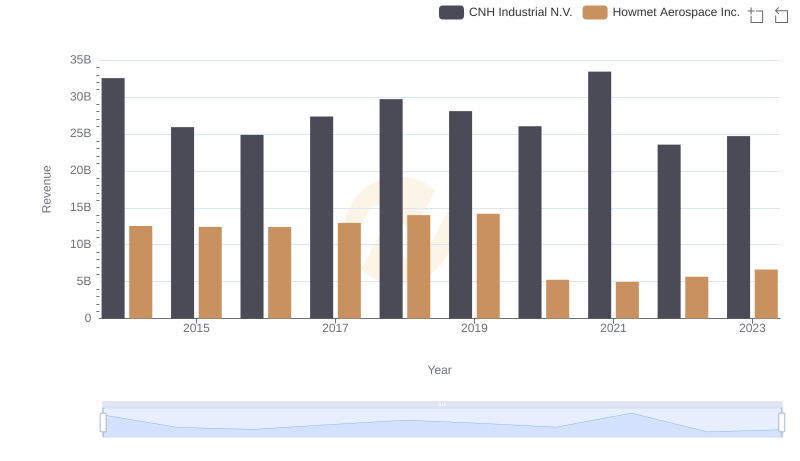
Breaking Down Revenue Trends: Howmet Aerospace Inc. vs CNH Industrial N.V.
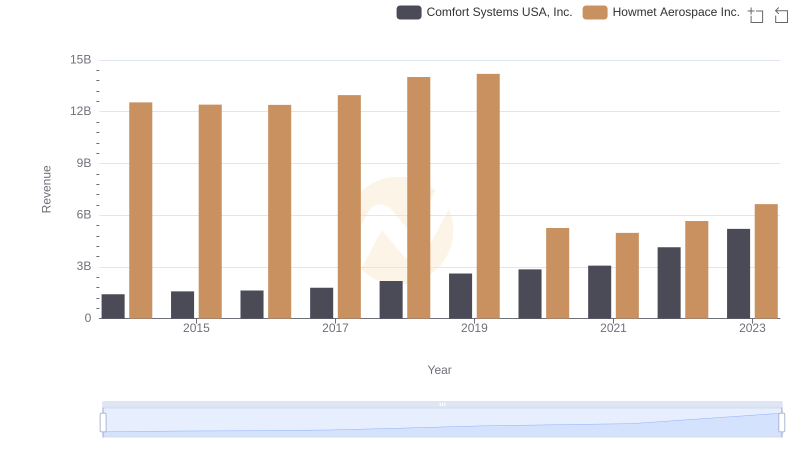
Annual Revenue Comparison: Howmet Aerospace Inc. vs Comfort Systems USA, Inc.
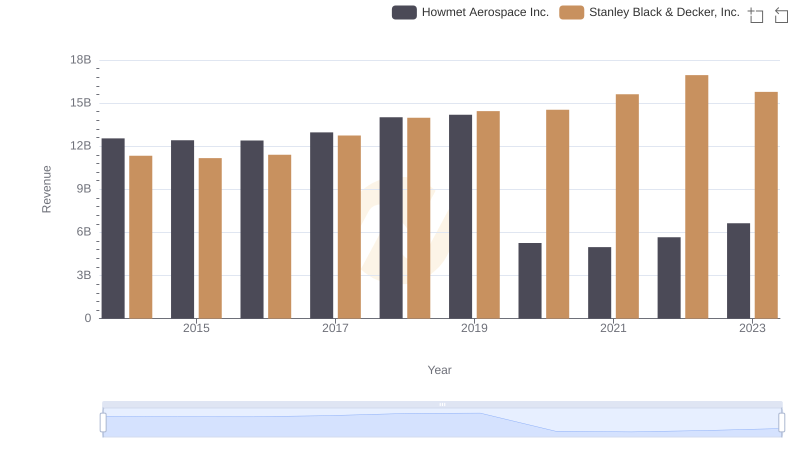
Annual Revenue Comparison: Howmet Aerospace Inc. vs Stanley Black & Decker, Inc.
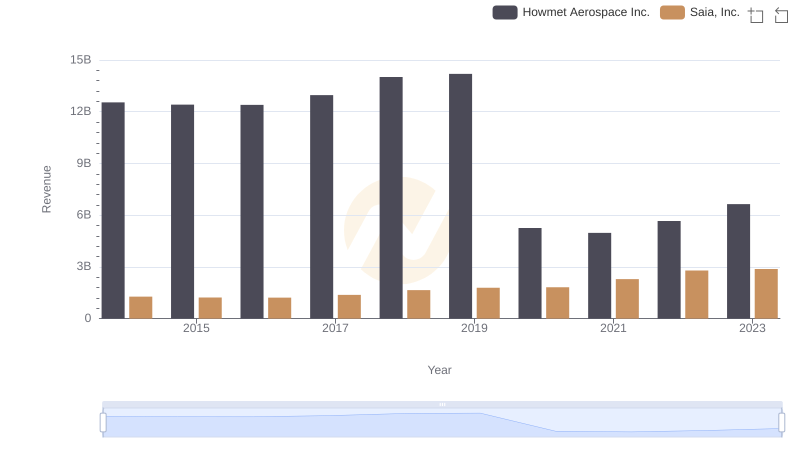
Howmet Aerospace Inc. vs Saia, Inc.: Annual Revenue Growth Compared
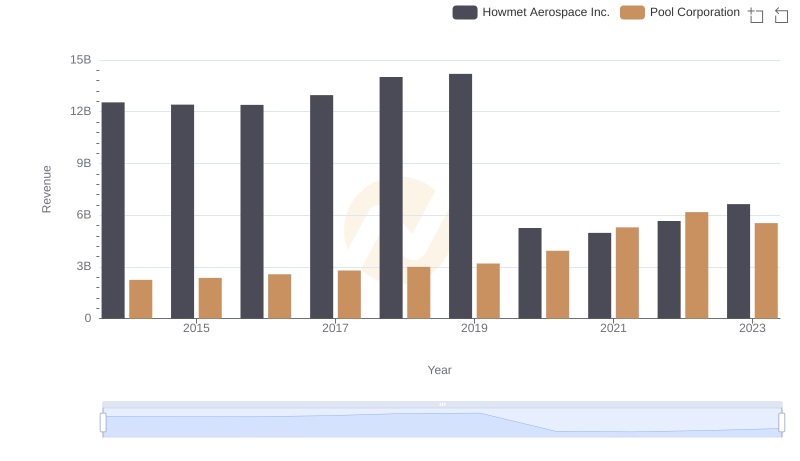
Who Generates More Revenue? Howmet Aerospace Inc. or Pool Corporation
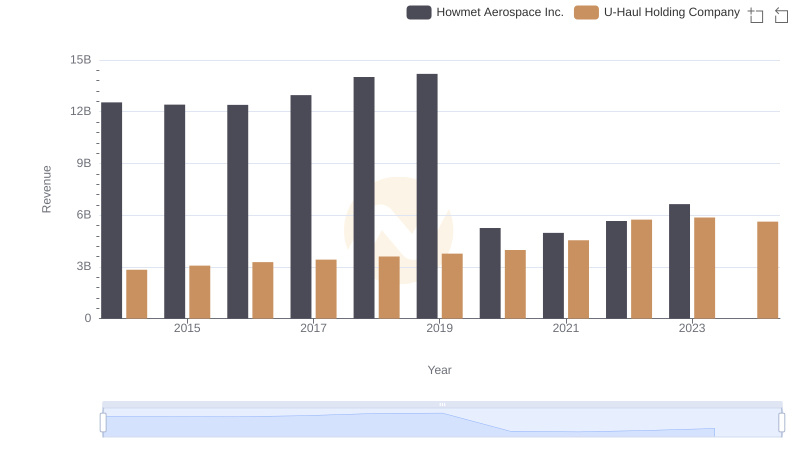
Who Generates More Revenue? Howmet Aerospace Inc. or U-Haul Holding Company
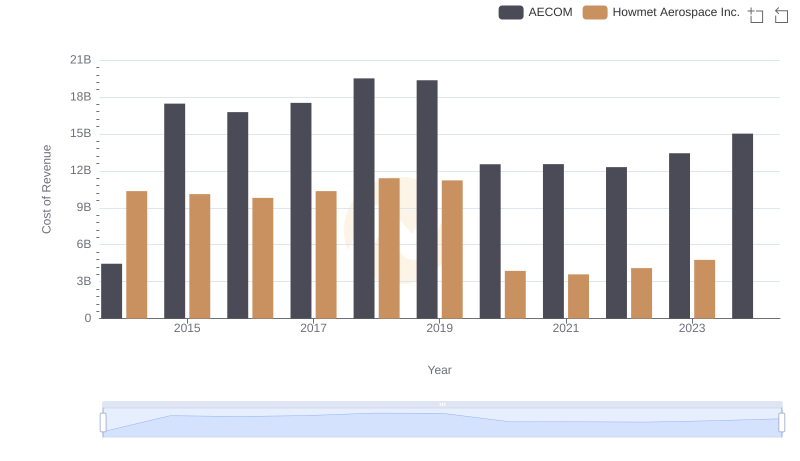
Cost of Revenue Comparison: Howmet Aerospace Inc. vs AECOM
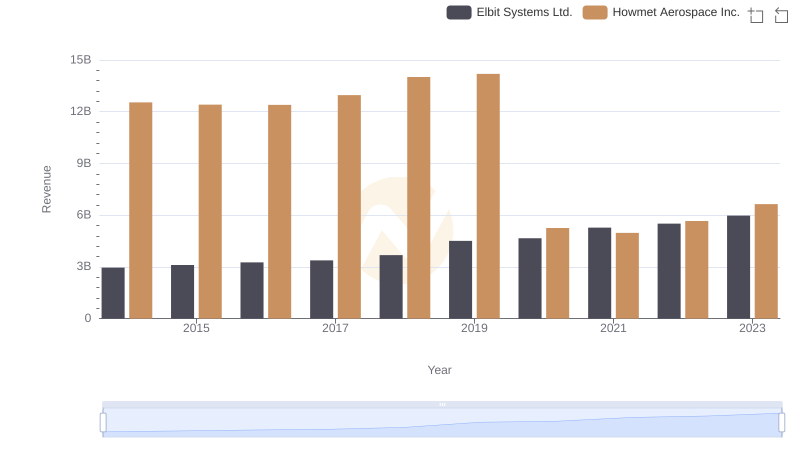
Revenue Showdown: Howmet Aerospace Inc. vs Elbit Systems Ltd.
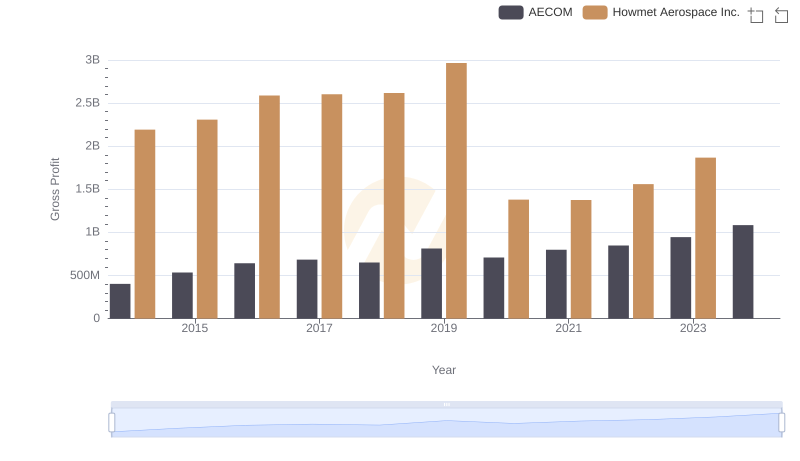
Gross Profit Trends Compared: Howmet Aerospace Inc. vs AECOM
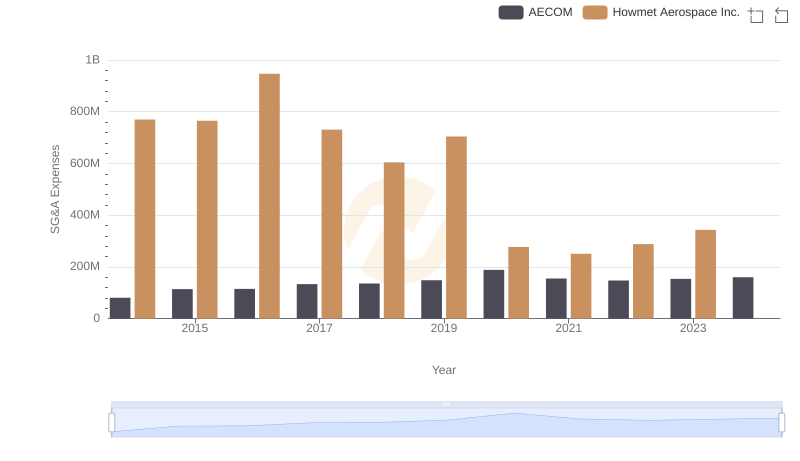
SG&A Efficiency Analysis: Comparing Howmet Aerospace Inc. and AECOM
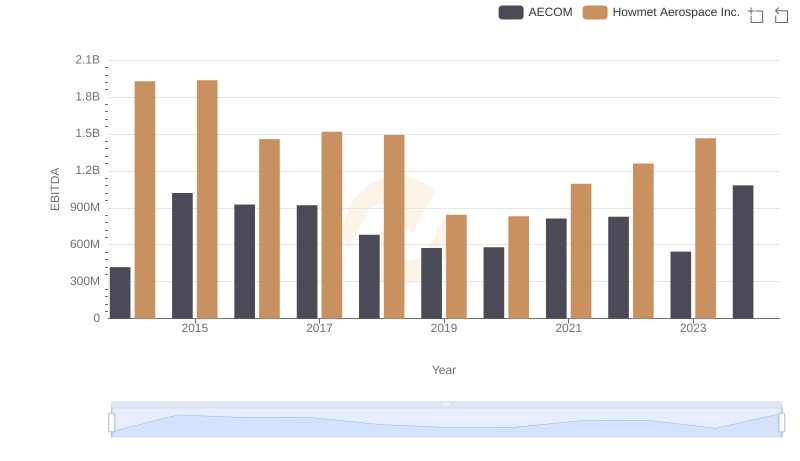
Howmet Aerospace Inc. and AECOM: A Detailed Examination of EBITDA Performance