| __timestamp | Howmet Aerospace Inc. | Stanley Black & Decker, Inc. |
|---|---|---|
| Wednesday, January 1, 2014 | 1927000000 | 1975400000 |
| Thursday, January 1, 2015 | 1936000000 | 1741900000 |
| Friday, January 1, 2016 | 1457000000 | 1810200000 |
| Sunday, January 1, 2017 | 1517000000 | 2196000000 |
| Monday, January 1, 2018 | 1491000000 | 1791200000 |
| Tuesday, January 1, 2019 | 843000000 | 1920600000 |
| Wednesday, January 1, 2020 | 831000000 | 2004200000 |
| Friday, January 1, 2021 | 1095000000 | 2345500000 |
| Saturday, January 1, 2022 | 1260000000 | 942800000 |
| Sunday, January 1, 2023 | 1465000000 | 802700000 |
| Monday, January 1, 2024 | 1842000000 | 286300000 |
Infusing magic into the data realm
In the ever-evolving landscape of industrial giants, Howmet Aerospace Inc. and Stanley Black & Decker, Inc. have showcased intriguing EBITDA trends over the past decade. From 2014 to 2023, Howmet Aerospace's EBITDA fluctuated, peaking in 2015 with a 40% higher value than its 2019 low. Meanwhile, Stanley Black & Decker experienced a similar rollercoaster, with its EBITDA reaching a zenith in 2021, nearly 150% of its 2023 figure.
The data reveals a compelling narrative of resilience and adaptation. Howmet Aerospace, despite a dip in 2019, rebounded by 76% by 2023. Stanley Black & Decker, however, faced a significant downturn post-2021, with a 66% drop by 2023. These trends underscore the dynamic nature of the industrial sector, where strategic pivots and market conditions play pivotal roles in shaping financial outcomes.
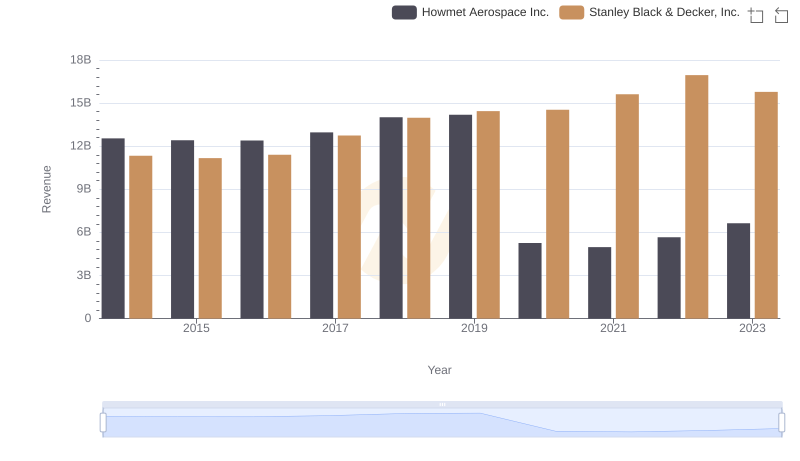
Howmet Aerospace Inc. vs Stanley Black & Decker, Inc.: Examining Key Revenue Metrics

Cost of Revenue Comparison: Howmet Aerospace Inc. vs Stanley Black & Decker, Inc.

Howmet Aerospace Inc. and Stanley Black & Decker, Inc.: A Detailed Gross Profit Analysis
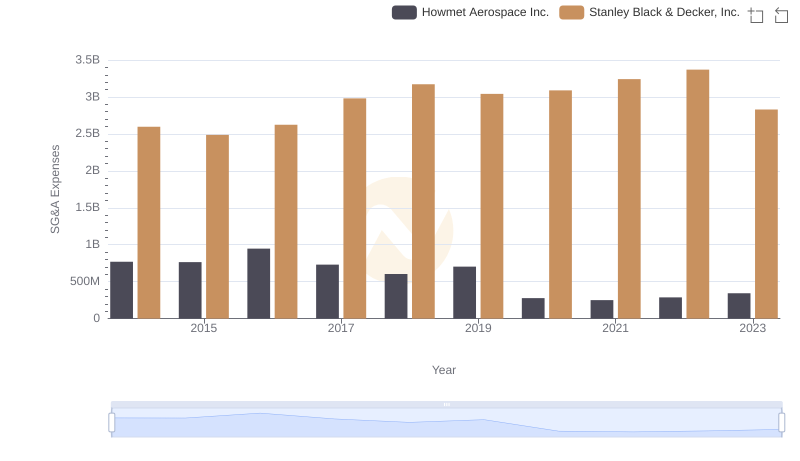
Breaking Down SG&A Expenses: Howmet Aerospace Inc. vs Stanley Black & Decker, Inc.
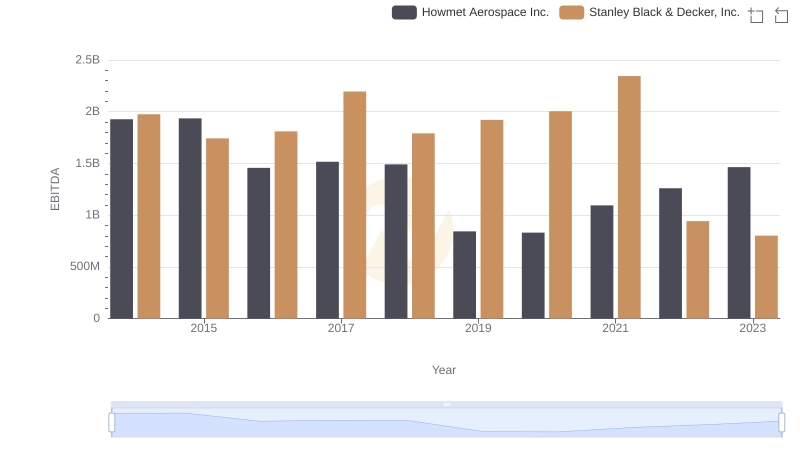
A Side-by-Side Analysis of EBITDA: Howmet Aerospace Inc. and Stanley Black & Decker, Inc.

Annual Revenue Comparison: Howmet Aerospace Inc. vs Stanley Black & Decker, Inc.
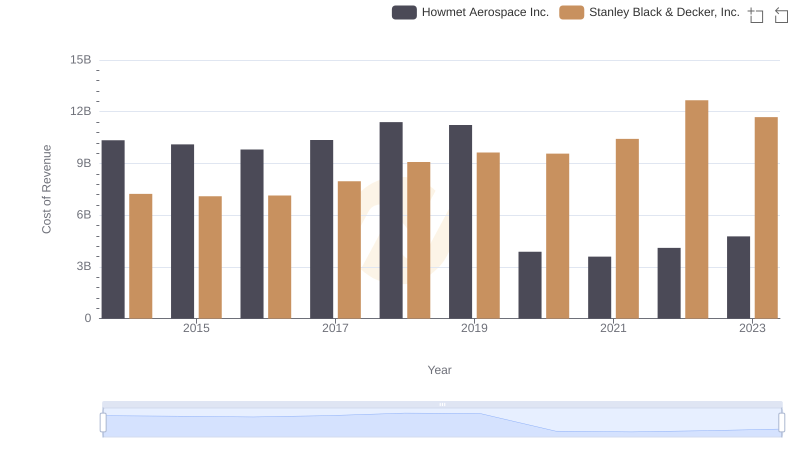
Cost of Revenue Comparison: Howmet Aerospace Inc. vs Stanley Black & Decker, Inc.
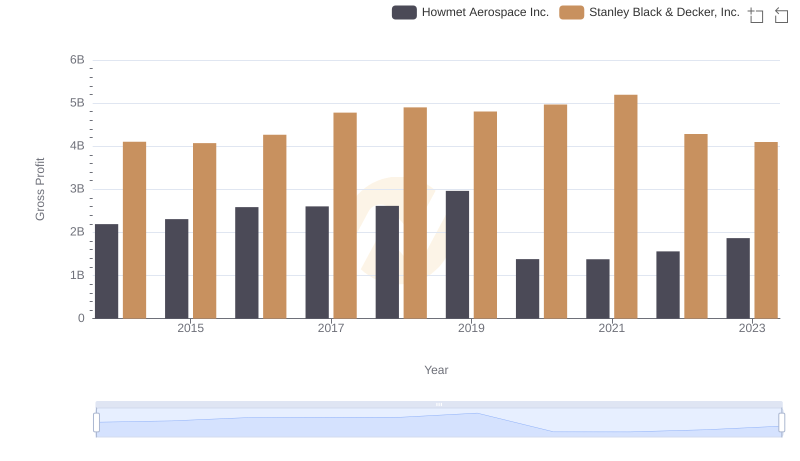
Who Generates Higher Gross Profit? Howmet Aerospace Inc. or Stanley Black & Decker, Inc.
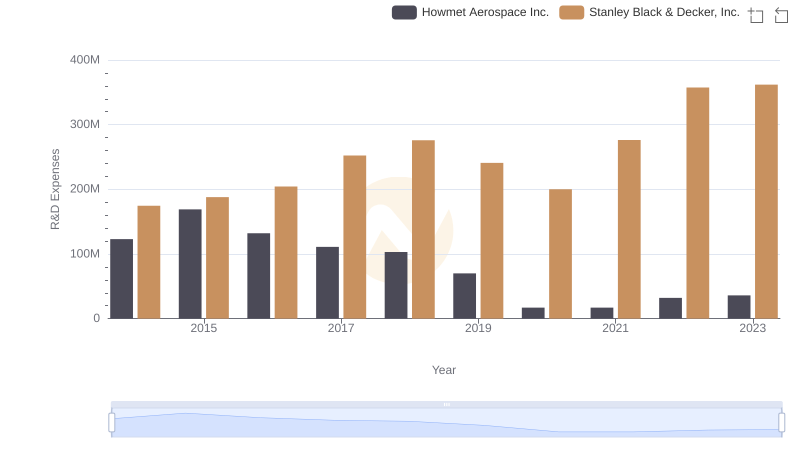
Howmet Aerospace Inc. or Stanley Black & Decker, Inc.: Who Invests More in Innovation?
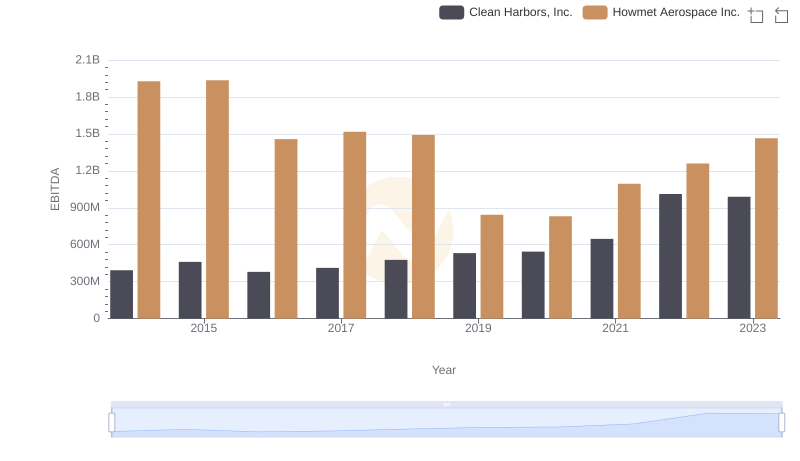
EBITDA Performance Review: Howmet Aerospace Inc. vs Clean Harbors, Inc.