| __timestamp | Howmet Aerospace Inc. | Stanley Black & Decker, Inc. |
|---|---|---|
| Wednesday, January 1, 2014 | 10349000000 | 7235900000 |
| Thursday, January 1, 2015 | 10104000000 | 7099800000 |
| Friday, January 1, 2016 | 9806000000 | 7139700000 |
| Sunday, January 1, 2017 | 10357000000 | 7969200000 |
| Monday, January 1, 2018 | 11397000000 | 9080500000 |
| Tuesday, January 1, 2019 | 11227000000 | 9636700000 |
| Wednesday, January 1, 2020 | 3878000000 | 9566700000 |
| Friday, January 1, 2021 | 3596000000 | 10423000000 |
| Saturday, January 1, 2022 | 4103000000 | 12663300000 |
| Sunday, January 1, 2023 | 4773000000 | 11683100000 |
| Monday, January 1, 2024 | 5119000000 | 10851300000 |
Unveiling the hidden dimensions of data
In the ever-evolving landscape of industrial giants, Howmet Aerospace Inc. and Stanley Black & Decker, Inc. have showcased intriguing cost dynamics over the past decade. From 2014 to 2023, Howmet Aerospace's cost of revenue saw a significant decline of approximately 54%, dropping from its peak in 2018. This shift reflects strategic adjustments, possibly in response to market demands or operational efficiencies. In contrast, Stanley Black & Decker experienced a robust 61% increase in their cost of revenue, peaking in 2022. This rise could indicate expansion efforts or increased production costs. Notably, 2020 marked a pivotal year for Howmet, with costs plummeting by 65%, likely due to global disruptions. As these industry leaders navigate the complexities of cost management, their financial strategies offer valuable insights into the broader economic trends shaping the manufacturing sector.
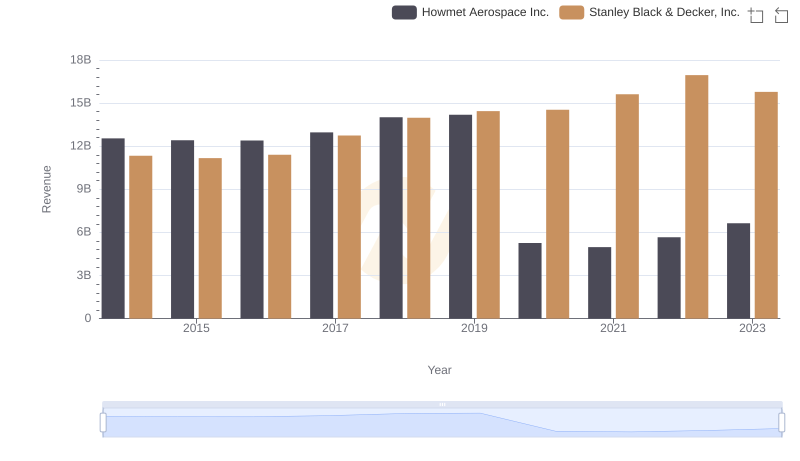
Howmet Aerospace Inc. vs Stanley Black & Decker, Inc.: Examining Key Revenue Metrics
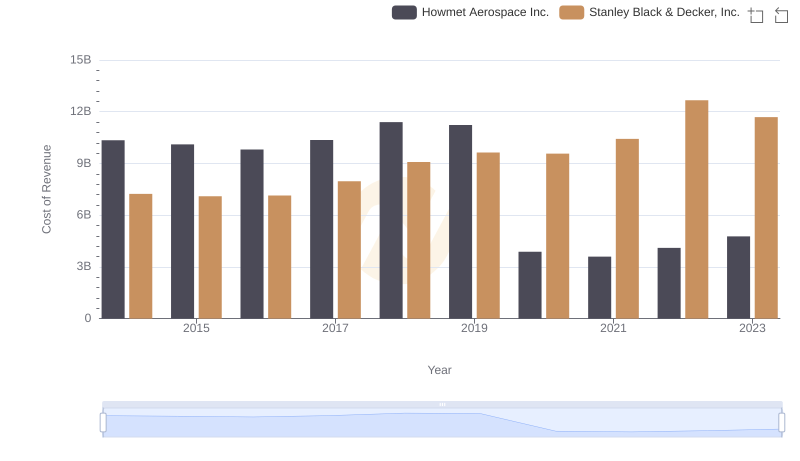
Cost of Revenue Comparison: Howmet Aerospace Inc. vs Stanley Black & Decker, Inc.

Howmet Aerospace Inc. and Stanley Black & Decker, Inc.: A Detailed Gross Profit Analysis
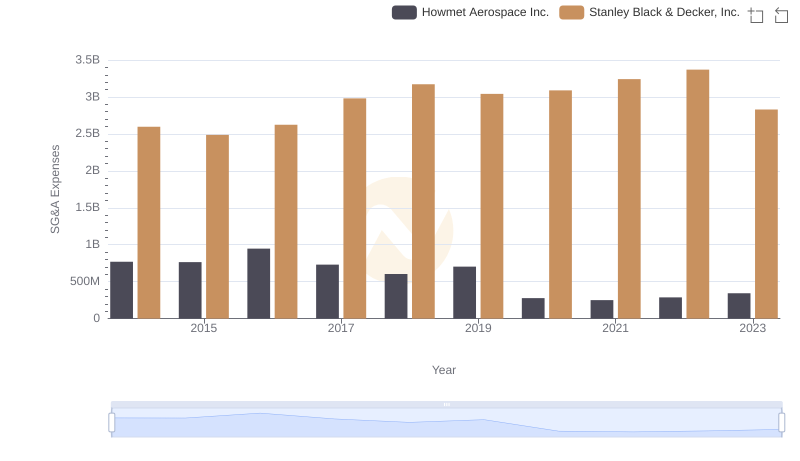
Breaking Down SG&A Expenses: Howmet Aerospace Inc. vs Stanley Black & Decker, Inc.

A Side-by-Side Analysis of EBITDA: Howmet Aerospace Inc. and Stanley Black & Decker, Inc.

Annual Revenue Comparison: Howmet Aerospace Inc. vs Stanley Black & Decker, Inc.
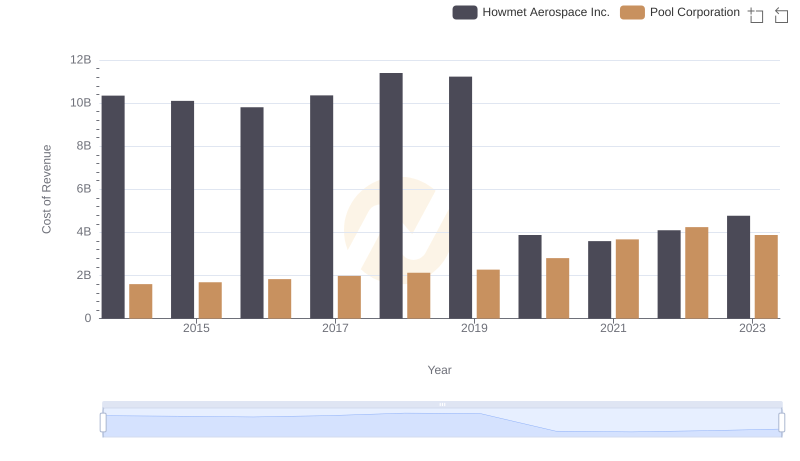
Cost of Revenue Trends: Howmet Aerospace Inc. vs Pool Corporation
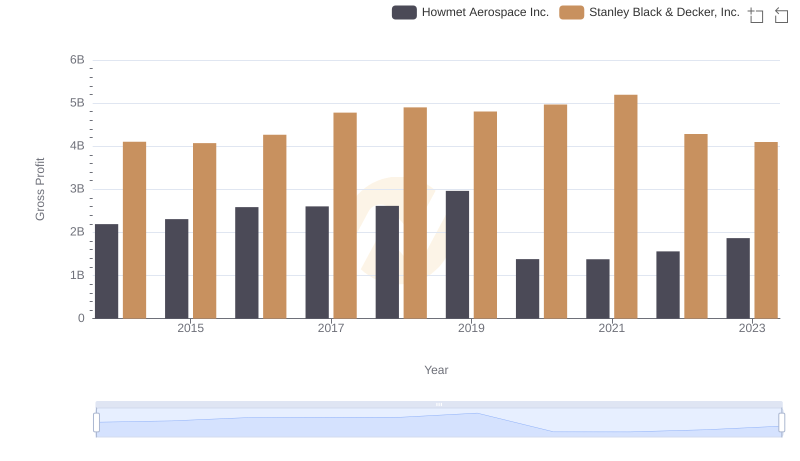
Who Generates Higher Gross Profit? Howmet Aerospace Inc. or Stanley Black & Decker, Inc.
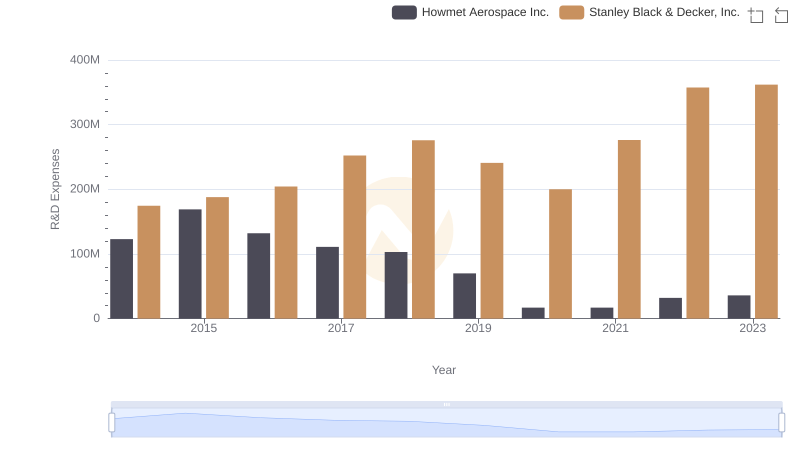
Howmet Aerospace Inc. or Stanley Black & Decker, Inc.: Who Invests More in Innovation?
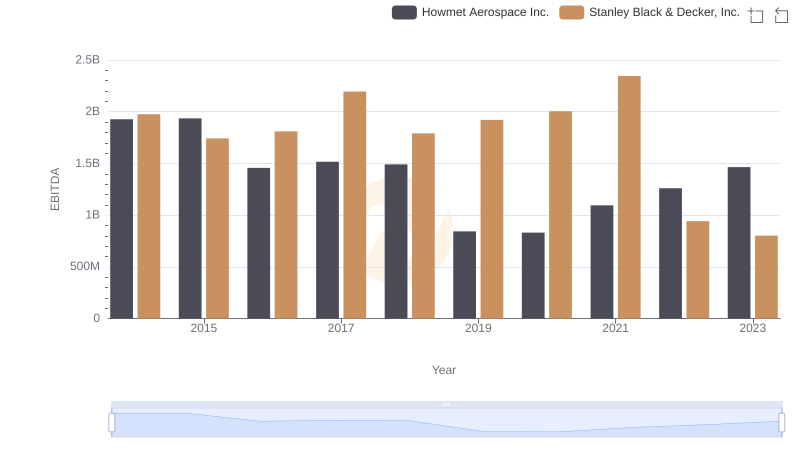
Howmet Aerospace Inc. and Stanley Black & Decker, Inc.: A Detailed Examination of EBITDA Performance