| __timestamp | CSX Corporation | Expeditors International of Washington, Inc. |
|---|---|---|
| Wednesday, January 1, 2014 | 9056000000 | 5800725000 |
| Thursday, January 1, 2015 | 8227000000 | 5720848000 |
| Friday, January 1, 2016 | 7680000000 | 5247244000 |
| Sunday, January 1, 2017 | 7635000000 | 6037921000 |
| Monday, January 1, 2018 | 7477000000 | 7118083000 |
| Tuesday, January 1, 2019 | 7063000000 | 7178405000 |
| Wednesday, January 1, 2020 | 6221000000 | 8953716000 |
| Friday, January 1, 2021 | 7382000000 | 14358105000 |
| Saturday, January 1, 2022 | 9068000000 | 14900154000 |
| Sunday, January 1, 2023 | 9130000000 | 8054634000 |
| Monday, January 1, 2024 | 0 |
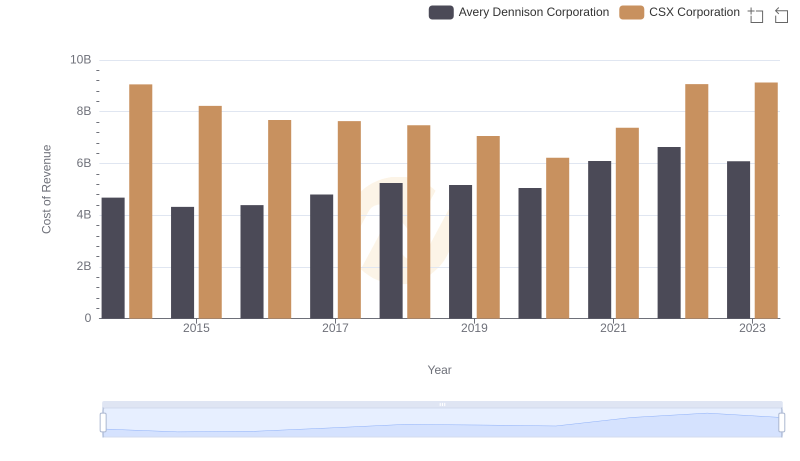
Cracking the code
In the ever-evolving landscape of the transportation and logistics industry, understanding cost dynamics is crucial. Over the past decade, CSX Corporation and Expeditors International of Washington, Inc. have showcased intriguing trends in their cost of revenue. From 2014 to 2023, CSX Corporation's cost of revenue fluctuated, peaking in 2023 with a 47% increase from its lowest point in 2020. Meanwhile, Expeditors International experienced a significant surge, with costs nearly tripling from 2014 to 2022, before a notable decline in 2023. This data highlights the resilience and adaptability of these companies amidst economic shifts and global challenges. As the industry continues to face disruptions, monitoring these trends offers valuable insights into operational efficiencies and strategic adjustments.