| __timestamp | CSX Corporation | Expeditors International of Washington, Inc. |
|---|---|---|
| Wednesday, January 1, 2014 | 4740000000 | 643940000 |
| Thursday, January 1, 2015 | 4890000000 | 767496000 |
| Friday, January 1, 2016 | 4640000000 | 716959000 |
| Sunday, January 1, 2017 | 5113000000 | 749570000 |
| Monday, January 1, 2018 | 6274000000 | 850582000 |
| Tuesday, January 1, 2019 | 6402000000 | 817642000 |
| Wednesday, January 1, 2020 | 5764000000 | 1013523000 |
| Friday, January 1, 2021 | 6653000000 | 1975928000 |
| Saturday, January 1, 2022 | 7390000000 | 1916506000 |
| Sunday, January 1, 2023 | 7340000000 | 1087588000 |
| Monday, January 1, 2024 | 1154330000 |
Unlocking the unknown
In the dynamic world of logistics and transportation, CSX Corporation and Expeditors International of Washington, Inc. have showcased intriguing EBITDA trends over the past decade. From 2014 to 2023, CSX Corporation's EBITDA surged by approximately 55%, reflecting its robust operational strategies and market adaptability. In contrast, Expeditors International experienced a remarkable 69% increase in EBITDA, peaking in 2021, driven by the global surge in demand for logistics services.
The year 2021 marked a pivotal point for both companies, with Expeditors International achieving its highest EBITDA, nearly tripling its 2014 figures. Meanwhile, CSX Corporation continued its steady growth trajectory, reaching its peak in 2022. These trends underscore the resilience and strategic prowess of both companies in navigating economic fluctuations and industry challenges. As the logistics landscape evolves, these insights offer a glimpse into the future potential of these industry giants.
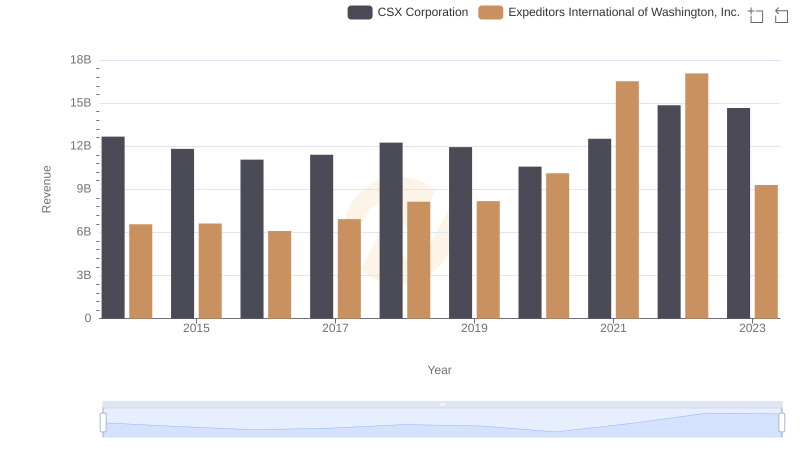
Annual Revenue Comparison: CSX Corporation vs Expeditors International of Washington, Inc.
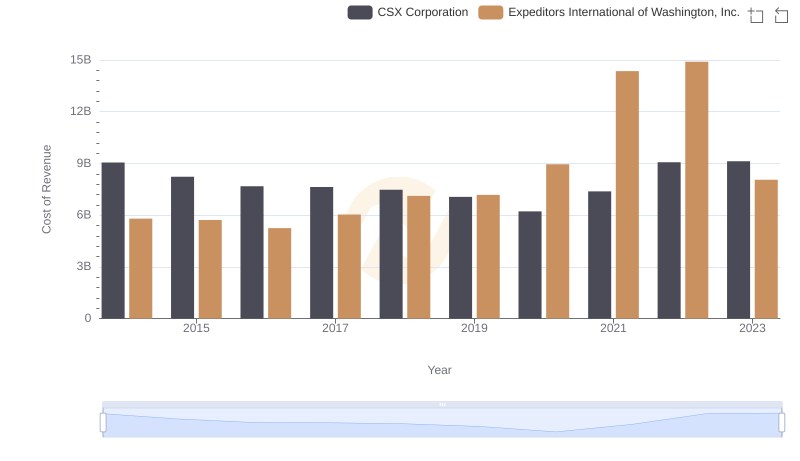
Cost of Revenue: Key Insights for CSX Corporation and Expeditors International of Washington, Inc.
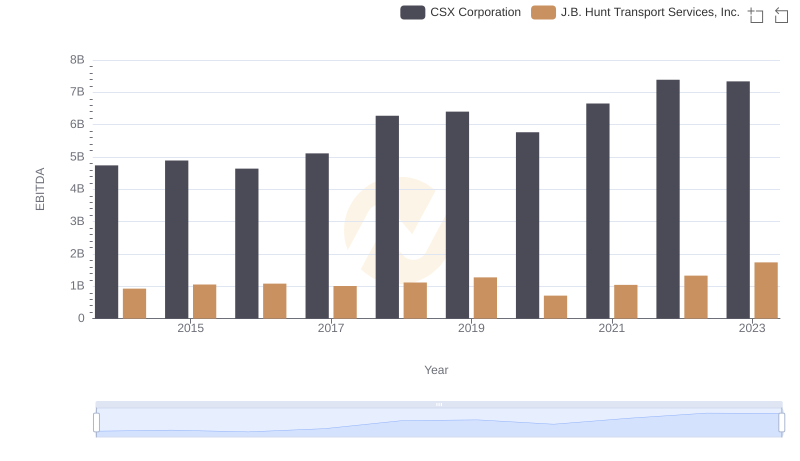
Professional EBITDA Benchmarking: CSX Corporation vs J.B. Hunt Transport Services, Inc.
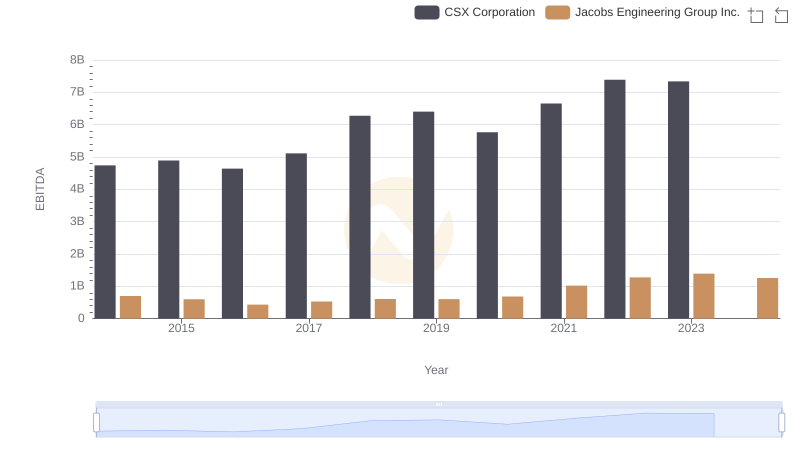
Comprehensive EBITDA Comparison: CSX Corporation vs Jacobs Engineering Group Inc.