| __timestamp | Union Pacific Corporation | Westinghouse Air Brake Technologies Corporation |
|---|---|---|
| Wednesday, January 1, 2014 | 14311000000 | 2130920000 |
| Thursday, January 1, 2015 | 12837000000 | 2281845000 |
| Friday, January 1, 2016 | 11672000000 | 2029647000 |
| Sunday, January 1, 2017 | 12231000000 | 2841159000 |
| Monday, January 1, 2018 | 13293000000 | 3151816000 |
| Tuesday, January 1, 2019 | 12094000000 | 6122400000 |
| Wednesday, January 1, 2020 | 10354000000 | 5657400000 |
| Friday, January 1, 2021 | 11290000000 | 5687000000 |
| Saturday, January 1, 2022 | 13670000000 | 6070000000 |
| Sunday, January 1, 2023 | 13590000000 | 6733000000 |
| Monday, January 1, 2024 | 13211000000 | 7021000000 |
Unveiling the hidden dimensions of data
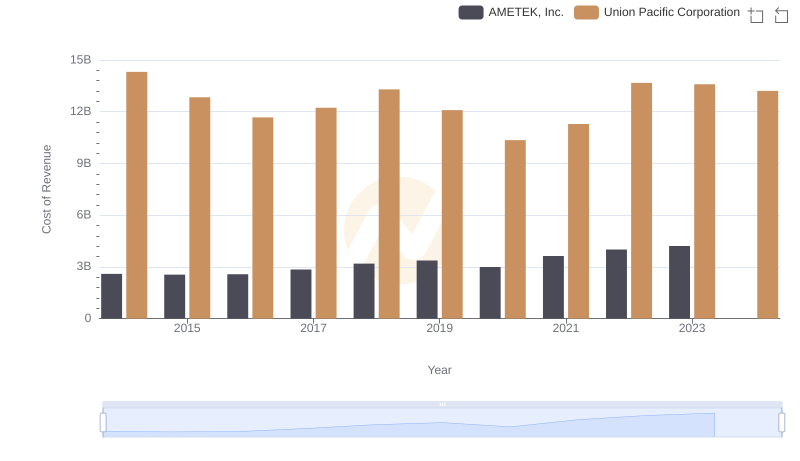
In the ever-evolving landscape of the transportation industry, understanding cost dynamics is crucial. Union Pacific Corporation, a titan in rail transport, and Westinghouse Air Brake Technologies Corporation, a leader in rail equipment, offer intriguing insights into cost management over the past decade. From 2014 to 2023, Union Pacific's cost of revenue fluctuated, peaking in 2014 and 2022, with a notable dip in 2020, reflecting a 28% decrease from its 2014 high. Meanwhile, Westinghouse Air Brake Technologies saw a steady rise, with costs more than tripling from 2014 to 2023, highlighting a significant expansion phase. The data for 2024 is incomplete, but the trends suggest a continued focus on cost efficiency. These insights underscore the strategic shifts in the rail industry, where balancing operational costs with growth remains paramount.