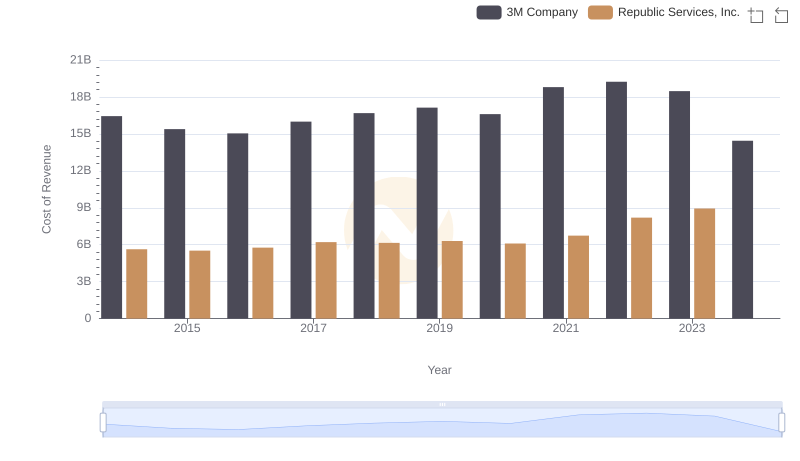
| __timestamp | 3M Company | Roper Technologies, Inc. |
|---|---|---|
| Wednesday, January 1, 2014 | 16447000000 | 1447595000 |
| Thursday, January 1, 2015 | 15383000000 | 1417749000 |
| Friday, January 1, 2016 | 15040000000 | 1457515000 |
| Sunday, January 1, 2017 | 16001000000 | 1742675000 |
| Monday, January 1, 2018 | 16682000000 | 1911700000 |
| Tuesday, January 1, 2019 | 17136000000 | 1939700000 |
| Wednesday, January 1, 2020 | 16605000000 | 1984100000 |
| Friday, January 1, 2021 | 18795000000 | 1860400000 |
| Saturday, January 1, 2022 | 19232000000 | 1619000000 |
| Sunday, January 1, 2023 | 18477000000 | 1870600000 |
| Monday, January 1, 2024 | 14447000000 | 2160900000 |
Unlocking the unknown
In the ever-evolving landscape of industrial giants, understanding cost efficiency is paramount. From 2014 to 2023, 3M Company and Roper Technologies, Inc. have showcased distinct trajectories in their cost of revenue. 3M Company, a stalwart in the manufacturing sector, saw its cost of revenue peak in 2022, marking a 17% increase from 2014. However, 2024 data indicates a significant drop, suggesting potential strategic shifts or market challenges.
Conversely, Roper Technologies, Inc., a leader in diversified technology, experienced a steady rise, with a notable 37% increase from 2014 to 2020. Yet, the subsequent years reveal fluctuations, with 2022 showing a 19% decrease from its 2020 peak. This volatility underscores the dynamic nature of tech-driven industries. Missing data for 2024 hints at ongoing transformations, inviting stakeholders to delve deeper into these industrial titans' strategies.