| __timestamp | Canadian National Railway Company | Graco Inc. |
|---|---|---|
| Wednesday, January 1, 2014 | 5674000000 | 369321000 |
| Thursday, January 1, 2015 | 6424000000 | 346732000 |
| Friday, January 1, 2016 | 6537000000 | 354454000 |
| Sunday, January 1, 2017 | 6839000000 | 408879000 |
| Monday, January 1, 2018 | 7124000000 | 472905000 |
| Tuesday, January 1, 2019 | 7999000000 | 466687000 |
| Wednesday, January 1, 2020 | 7652000000 | 440431000 |
| Friday, January 1, 2021 | 7607000000 | 578005000 |
| Saturday, January 1, 2022 | 9067000000 | 641618000 |
| Sunday, January 1, 2023 | 9027000000 | 686593000 |
| Monday, January 1, 2024 | 570098000 |
Igniting the spark of knowledge
In the ever-evolving landscape of North American industry, the financial performance of Canadian National Railway Company (CNR) and Graco Inc. offers a fascinating glimpse into the dynamics of transportation and manufacturing sectors. From 2014 to 2023, CNR's EBITDA has shown a robust growth trajectory, peaking at approximately $9 billion in 2022, a remarkable 60% increase from 2014. Meanwhile, Graco Inc., a leader in fluid handling systems, has steadily increased its EBITDA by nearly 86% over the same period, reaching around $687 million in 2023.
This side-by-side analysis highlights the resilience and adaptability of these companies amidst economic fluctuations. While CNR's growth reflects the critical role of rail transport in North America's supply chain, Graco's performance underscores the importance of innovation in manufacturing. Notably, 2024 data for CNR is missing, leaving room for speculation on its future trajectory.
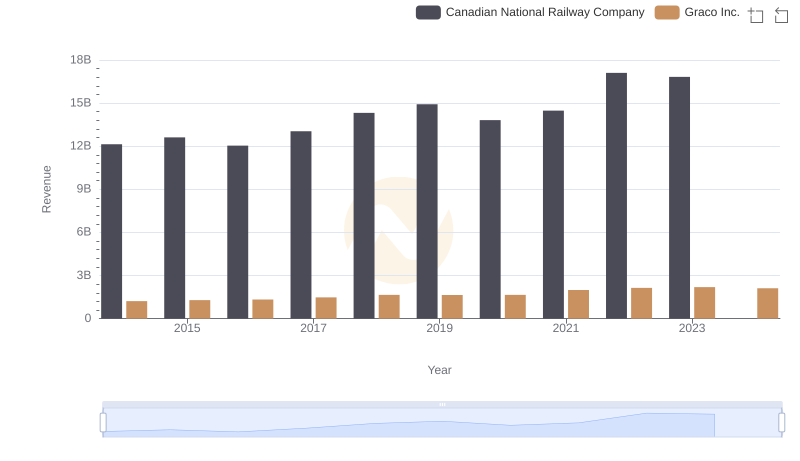
Canadian National Railway Company and Graco Inc.: A Comprehensive Revenue Analysis
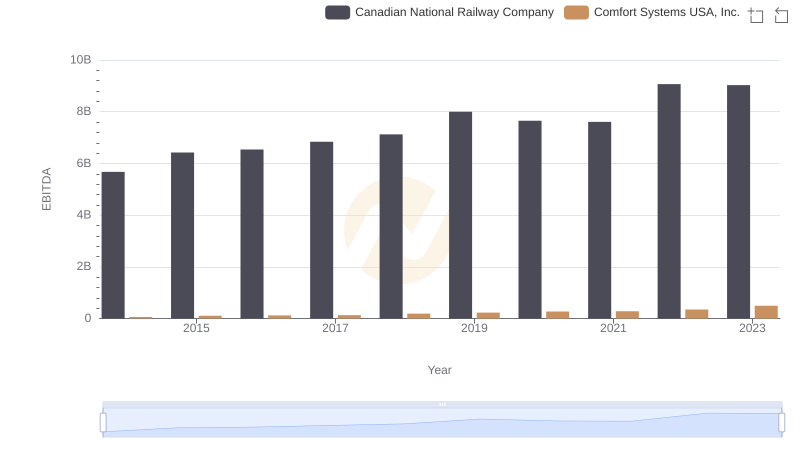
EBITDA Analysis: Evaluating Canadian National Railway Company Against Comfort Systems USA, Inc.
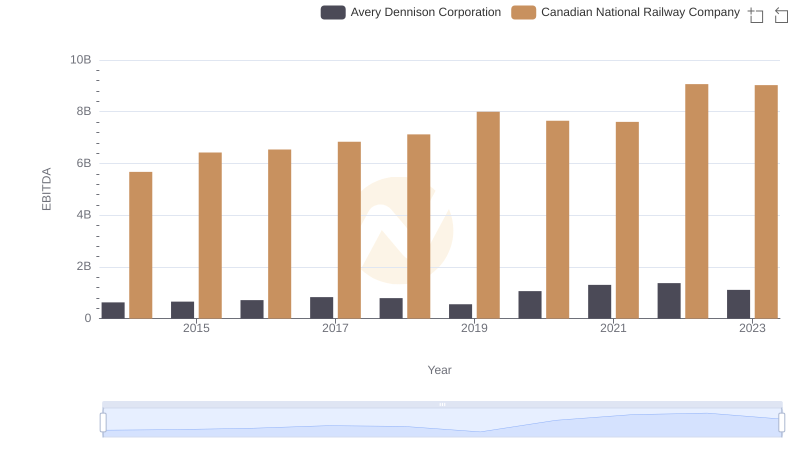
Professional EBITDA Benchmarking: Canadian National Railway Company vs Avery Dennison Corporation
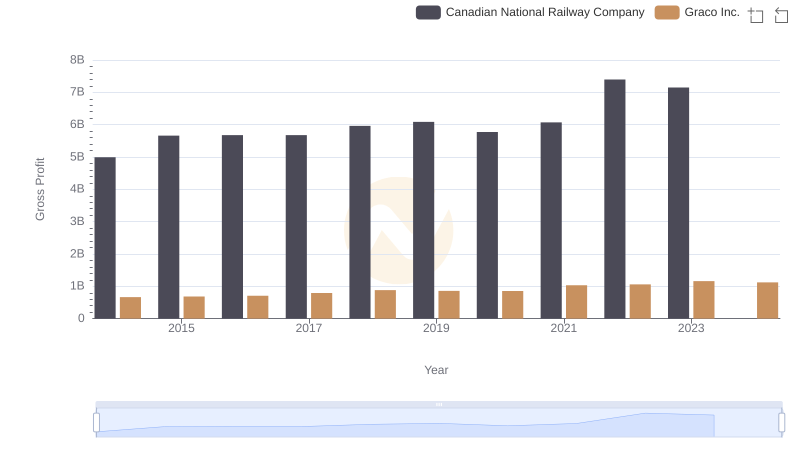
Canadian National Railway Company vs Graco Inc.: A Gross Profit Performance Breakdown
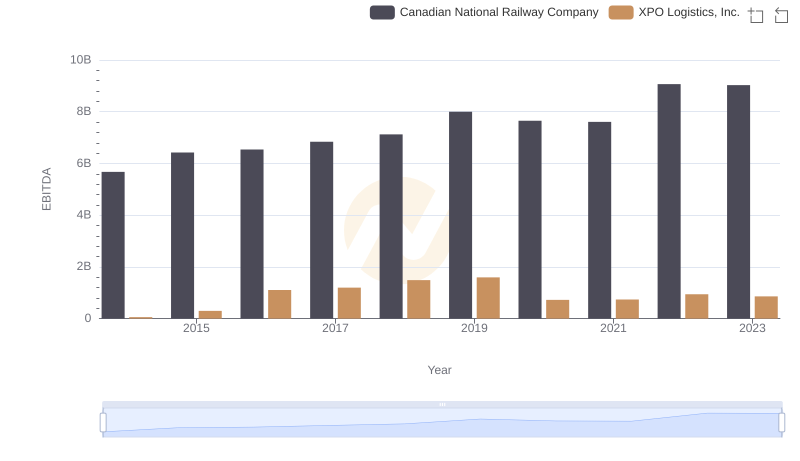
EBITDA Metrics Evaluated: Canadian National Railway Company vs XPO Logistics, Inc.
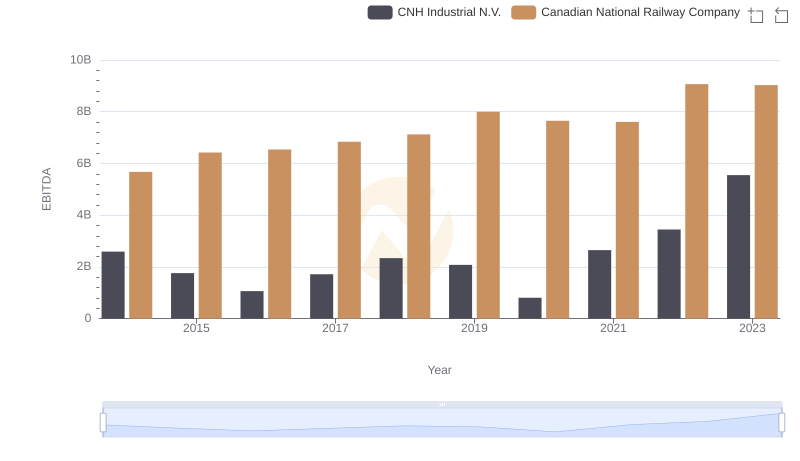
A Professional Review of EBITDA: Canadian National Railway Company Compared to CNH Industrial N.V.

EBITDA Metrics Evaluated: Canadian National Railway Company vs Saia, Inc.