| __timestamp | Automatic Data Processing, Inc. | Northrop Grumman Corporation |
|---|---|---|
| Wednesday, January 1, 2014 | 2616900000 | 3681000000 |
| Thursday, January 1, 2015 | 2355100000 | 3558000000 |
| Friday, January 1, 2016 | 2579500000 | 3394000000 |
| Sunday, January 1, 2017 | 2927200000 | 4928000000 |
| Monday, January 1, 2018 | 2762900000 | 5104000000 |
| Tuesday, January 1, 2019 | 3544500000 | 4234000000 |
| Wednesday, January 1, 2020 | 3769700000 | 5588000000 |
| Friday, January 1, 2021 | 3931600000 | 8734000000 |
| Saturday, January 1, 2022 | 4405500000 | 7684000000 |
| Sunday, January 1, 2023 | 5244600000 | 4229000000 |
| Monday, January 1, 2024 | 5800000000 | 4370000000 |
Unlocking the unknown
In the ever-evolving landscape of corporate finance, EBITDA serves as a crucial metric for evaluating a company's operational performance. Over the past decade, Automatic Data Processing, Inc. (ADP) and Northrop Grumman Corporation have showcased intriguing trends in their EBITDA figures. From 2014 to 2023, ADP's EBITDA grew by approximately 122%, reflecting a robust upward trajectory. In contrast, Northrop Grumman experienced a more volatile path, peaking in 2021 with an EBITDA nearly 137% higher than its 2014 figure, before declining in 2023. This divergence highlights the distinct strategic approaches of these industry giants. While ADP's consistent growth underscores its stable business model, Northrop Grumman's fluctuations may indicate the impact of external factors such as defense contracts and geopolitical dynamics. As we look to 2024, ADP's continued growth trajectory is evident, though Northrop Grumman's data remains incomplete, leaving room for speculation.
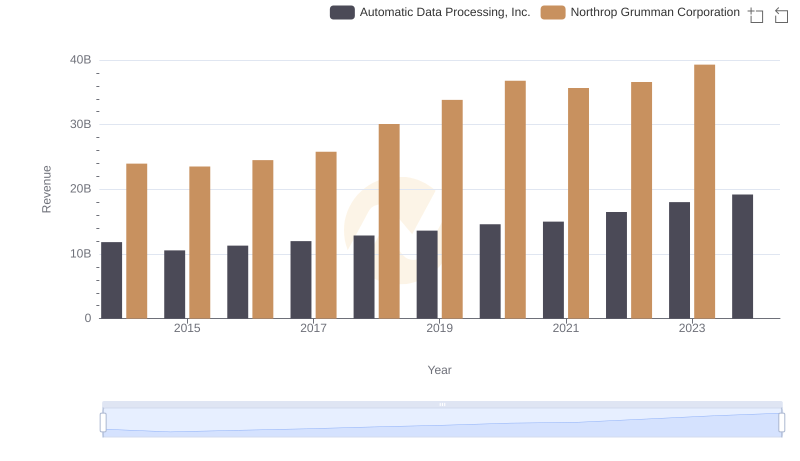
Breaking Down Revenue Trends: Automatic Data Processing, Inc. vs Northrop Grumman Corporation
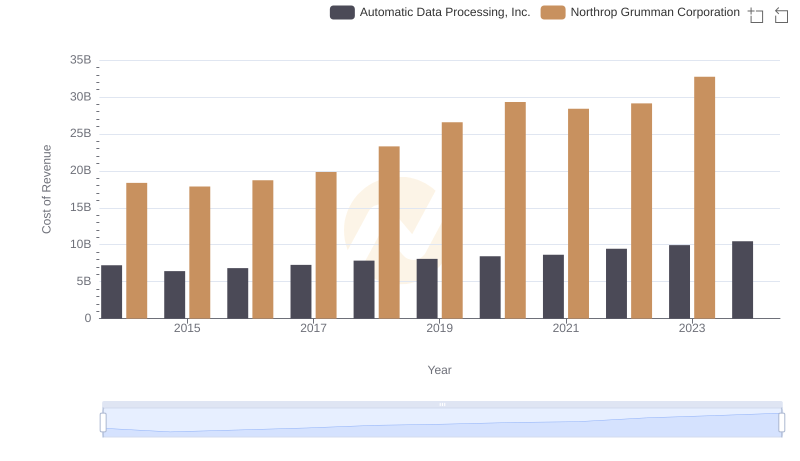
Automatic Data Processing, Inc. vs Northrop Grumman Corporation: Efficiency in Cost of Revenue Explored

Cost Management Insights: SG&A Expenses for Automatic Data Processing, Inc. and Northrop Grumman Corporation
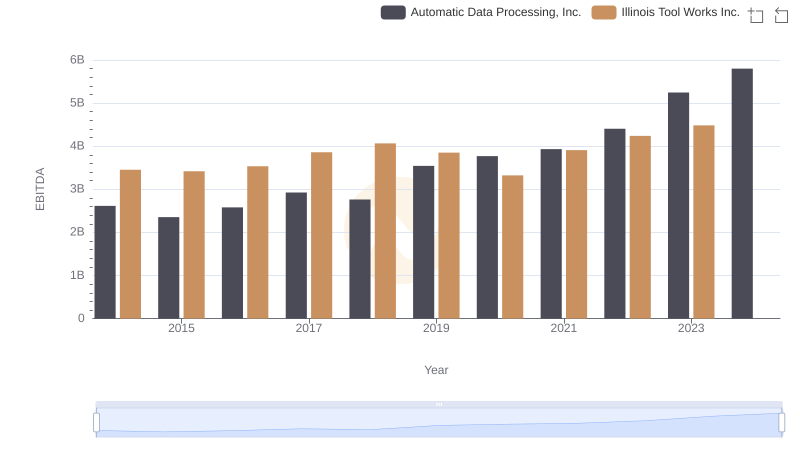
A Professional Review of EBITDA: Automatic Data Processing, Inc. Compared to Illinois Tool Works Inc.
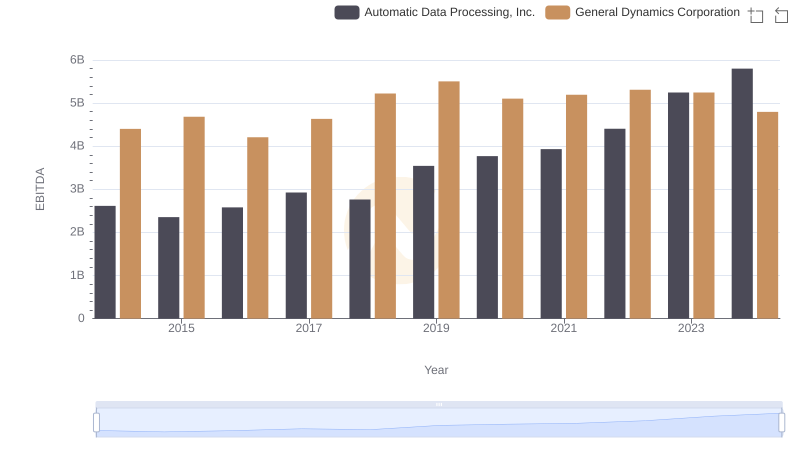
A Professional Review of EBITDA: Automatic Data Processing, Inc. Compared to General Dynamics Corporation
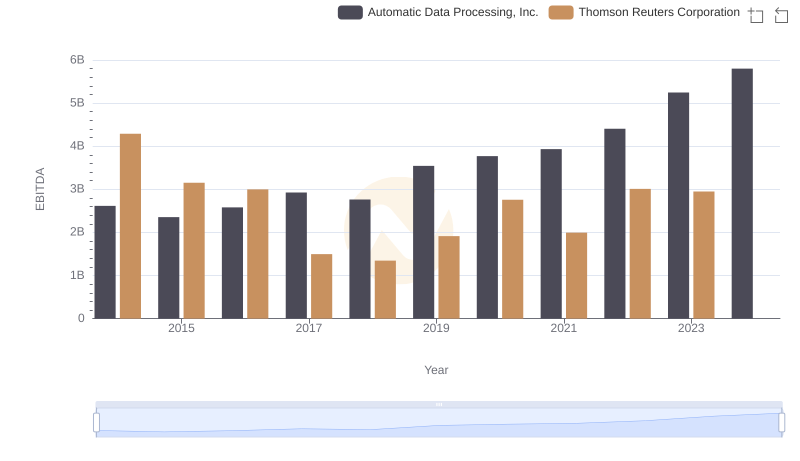
EBITDA Analysis: Evaluating Automatic Data Processing, Inc. Against Thomson Reuters Corporation
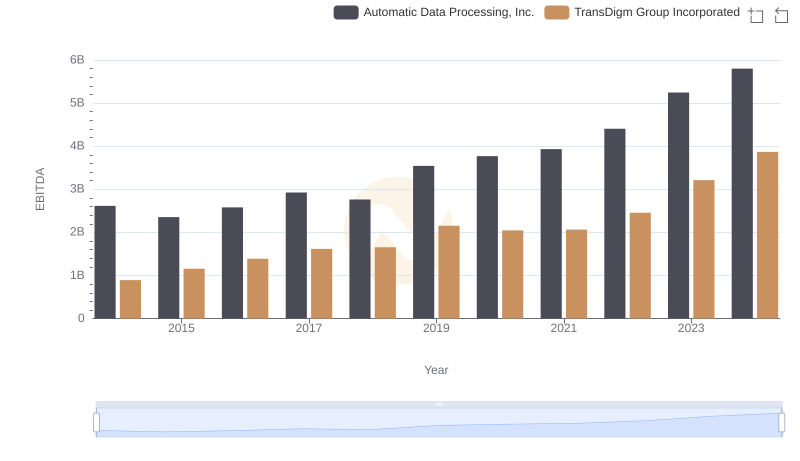
Professional EBITDA Benchmarking: Automatic Data Processing, Inc. vs TransDigm Group Incorporated
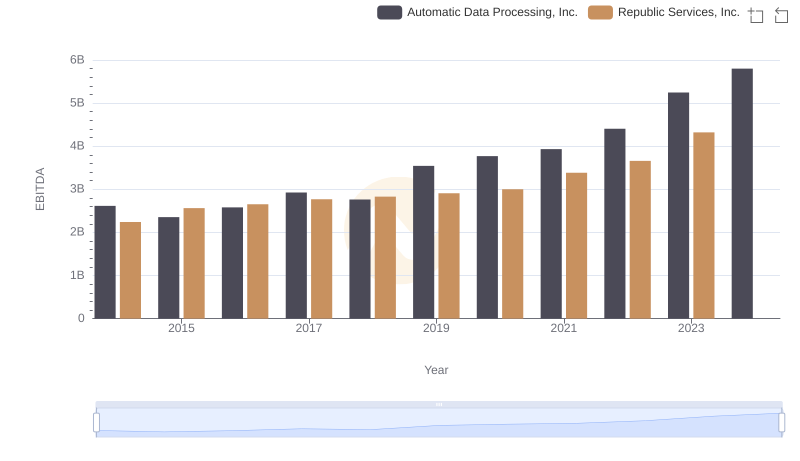
A Side-by-Side Analysis of EBITDA: Automatic Data Processing, Inc. and Republic Services, Inc.
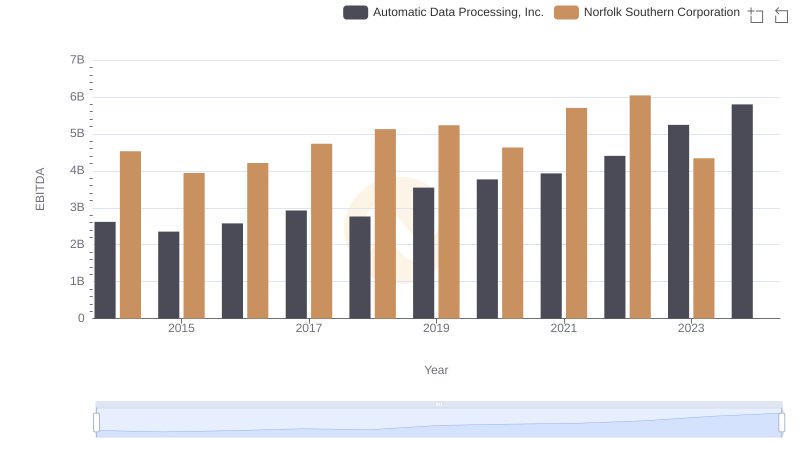
Comparative EBITDA Analysis: Automatic Data Processing, Inc. vs Norfolk Southern Corporation