| __timestamp | II-VI Incorporated | VMware, Inc. |
|---|---|---|
| Wednesday, January 1, 2014 | 137707000 | 2234000000 |
| Thursday, January 1, 2015 | 143539000 | 2836000000 |
| Friday, January 1, 2016 | 160646000 | 3033000000 |
| Sunday, January 1, 2017 | 176002000 | 3046000000 |
| Monday, January 1, 2018 | 208565000 | 3247000000 |
| Tuesday, January 1, 2019 | 233518000 | 3682000000 |
| Wednesday, January 1, 2020 | 440998000 | 4970000000 |
| Friday, January 1, 2021 | 483989000 | 4478000000 |
| Saturday, January 1, 2022 | 474096000 | 5135000000 |
| Sunday, January 1, 2023 | 1036699000 | 5521000000 |
| Monday, January 1, 2024 | 854001000 |
Igniting the spark of knowledge
In the competitive world of technology and manufacturing, managing Selling, General, and Administrative (SG&A) expenses is crucial for profitability. Over the past decade, VMware, Inc. and II-VI Incorporated have showcased contrasting strategies in this domain. From 2014 to 2023, VMware's SG&A expenses have consistently been higher, peaking at $5.5 billion in 2023, reflecting a 147% increase from 2014. In contrast, II-VI Incorporated, while starting with significantly lower expenses, saw a dramatic rise of 653%, reaching $1.04 billion in 2023. This stark difference highlights VMware's expansive operational scale compared to II-VI's rapid growth trajectory. As businesses navigate economic uncertainties, understanding these trends offers valuable insights into strategic cost management.
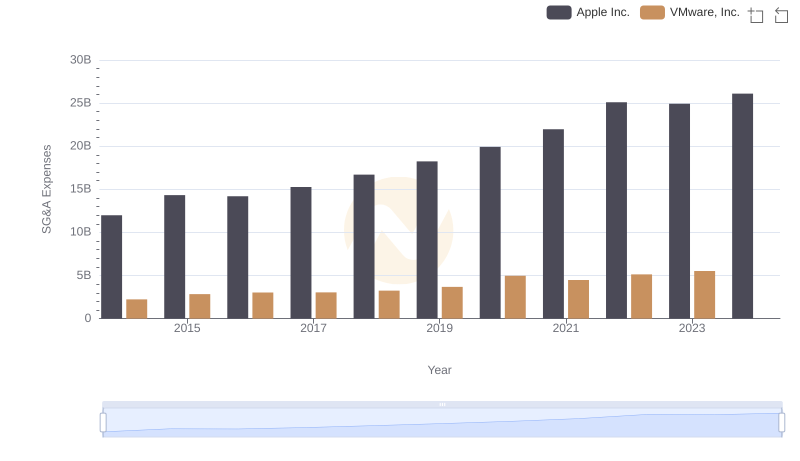
Who Optimizes SG&A Costs Better? Apple Inc. or VMware, Inc.
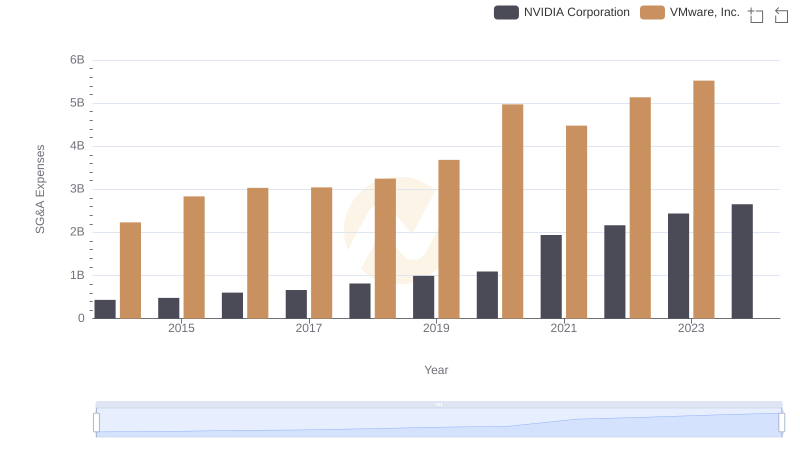
NVIDIA Corporation and VMware, Inc.: SG&A Spending Patterns Compared
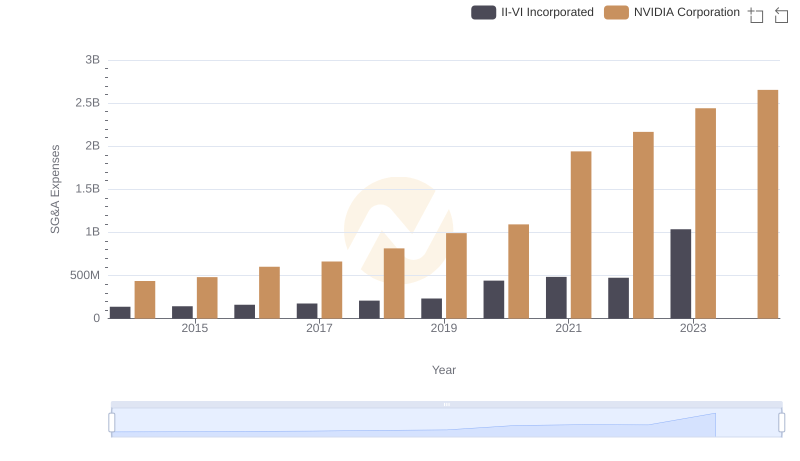
Breaking Down SG&A Expenses: NVIDIA Corporation vs II-VI Incorporated
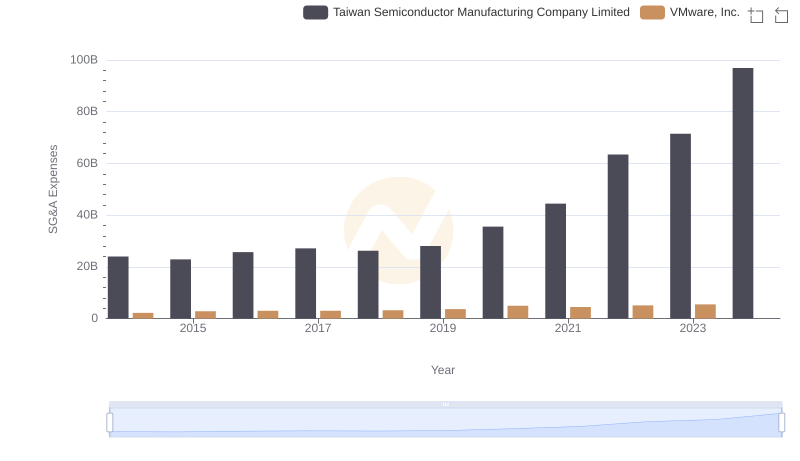
Operational Costs Compared: SG&A Analysis of Taiwan Semiconductor Manufacturing Company Limited and VMware, Inc.
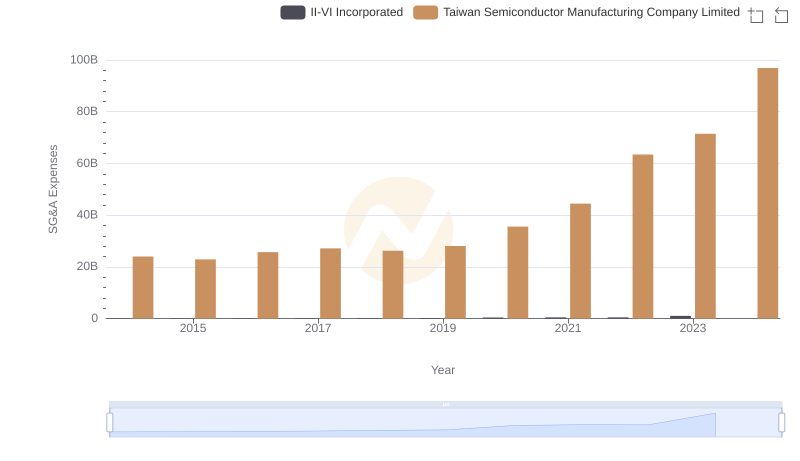
Taiwan Semiconductor Manufacturing Company Limited and II-VI Incorporated: SG&A Spending Patterns Compared
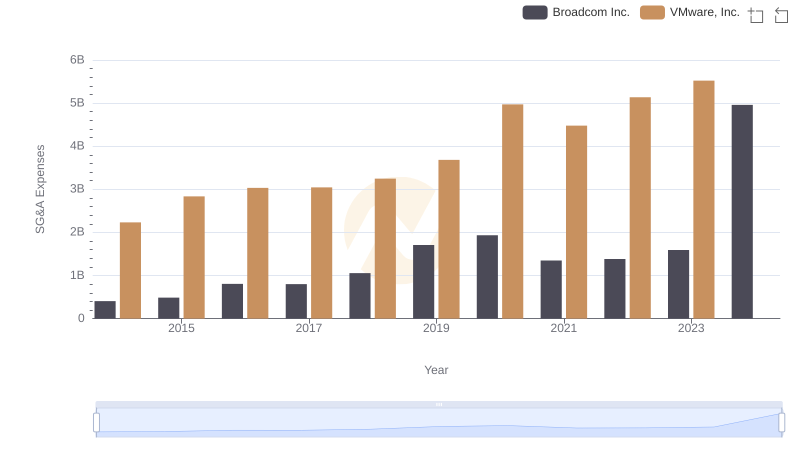
Selling, General, and Administrative Costs: Broadcom Inc. vs VMware, Inc.
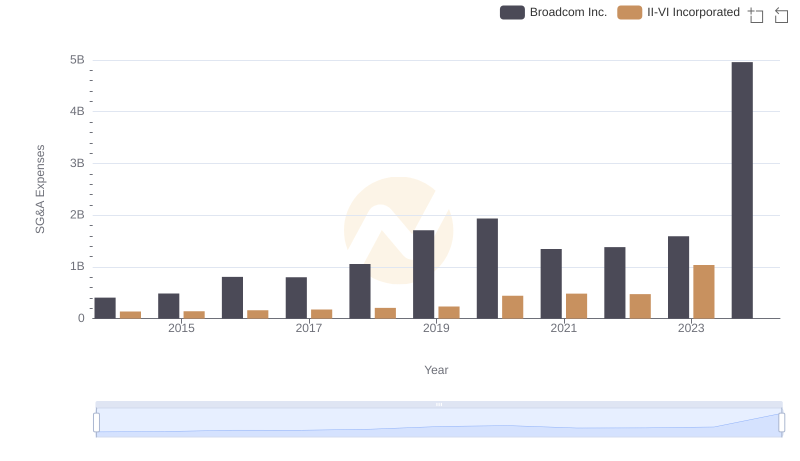
Operational Costs Compared: SG&A Analysis of Broadcom Inc. and II-VI Incorporated
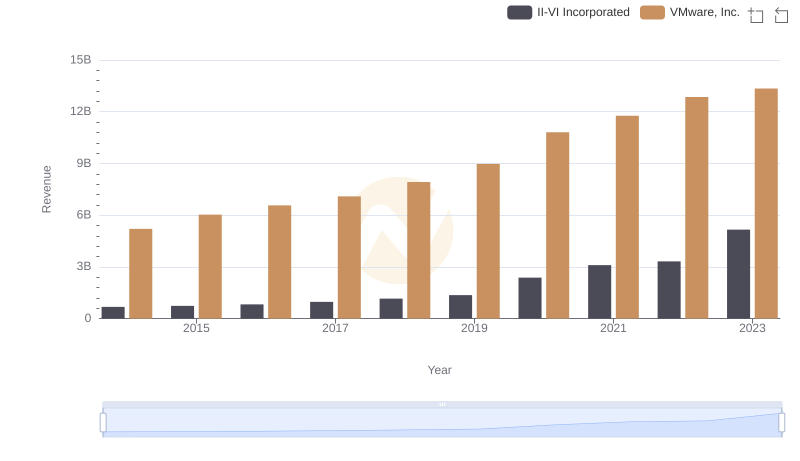
VMware, Inc. vs II-VI Incorporated: Examining Key Revenue Metrics
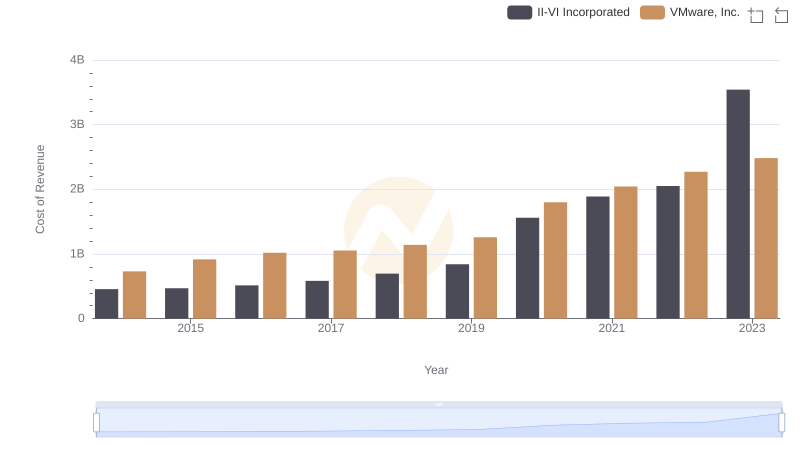
Cost of Revenue Comparison: VMware, Inc. vs II-VI Incorporated
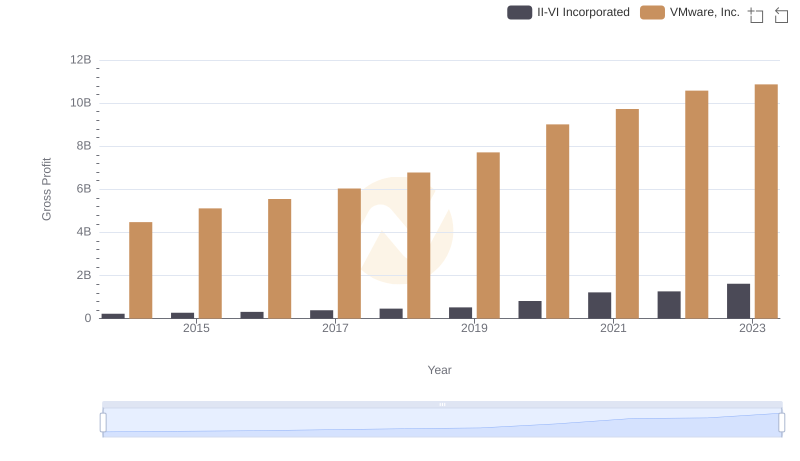
Gross Profit Analysis: Comparing VMware, Inc. and II-VI Incorporated
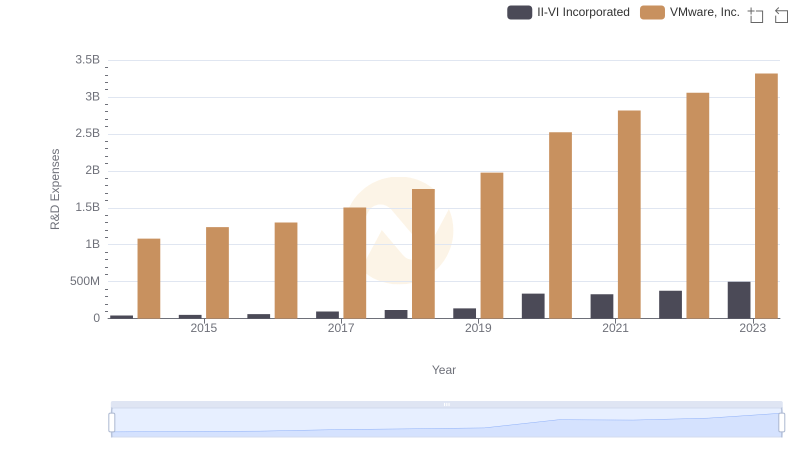
Comparing Innovation Spending: VMware, Inc. and II-VI Incorporated
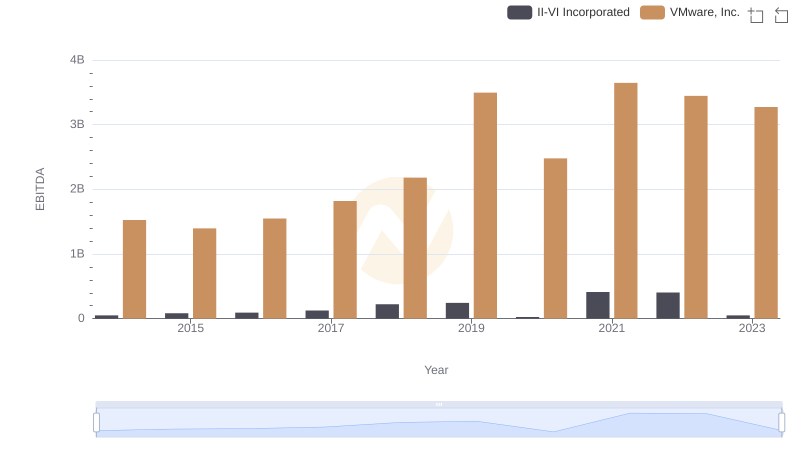
EBITDA Performance Review: VMware, Inc. vs II-VI Incorporated