| __timestamp | II-VI Incorporated | VMware, Inc. |
|---|---|---|
| Wednesday, January 1, 2014 | 42523000 | 1082000000 |
| Thursday, January 1, 2015 | 51260000 | 1239000000 |
| Friday, January 1, 2016 | 60354000 | 1300000000 |
| Sunday, January 1, 2017 | 96810000 | 1503000000 |
| Monday, January 1, 2018 | 116875000 | 1755000000 |
| Tuesday, January 1, 2019 | 139163000 | 1975000000 |
| Wednesday, January 1, 2020 | 339073000 | 2522000000 |
| Friday, January 1, 2021 | 330105000 | 2816000000 |
| Saturday, January 1, 2022 | 377106000 | 3057000000 |
| Sunday, January 1, 2023 | 499603000 | 3317000000 |
| Monday, January 1, 2024 | 478788000 |
Data in motion
In the ever-evolving tech landscape, innovation is the lifeblood of success. This chart offers a fascinating glimpse into the research and development (R&D) spending trends of VMware, Inc. and II-VI Incorporated from 2014 to 2023. Over this period, VMware consistently outpaced II-VI in R&D investment, with its spending growing by over 200% from 2014 to 2023. In contrast, II-VI's R&D expenses surged by more than 1,000%, reflecting its aggressive push into new technologies.
By 2023, VMware's R&D expenses reached a staggering 3.3 billion, while II-VI's spending hit nearly 500 million. This disparity highlights VMware's dominant position in the tech industry, yet II-VI's rapid growth underscores its ambition to challenge the status quo. As these companies continue to innovate, their R&D investments will be crucial in shaping the future of technology.
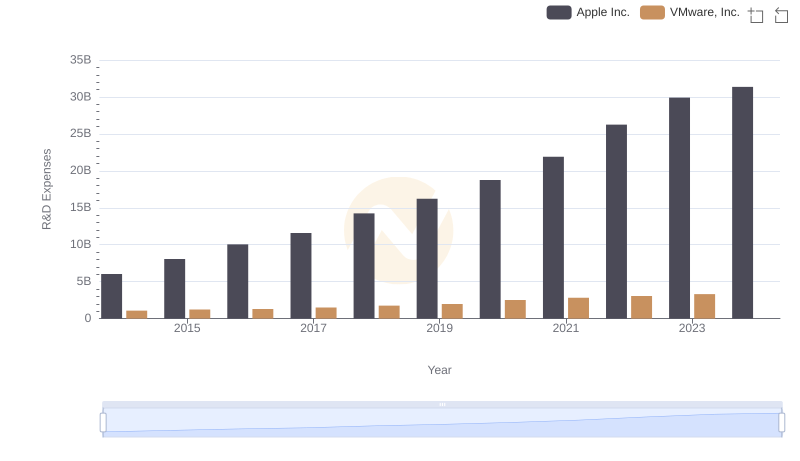
Research and Development: Comparing Key Metrics for Apple Inc. and VMware, Inc.
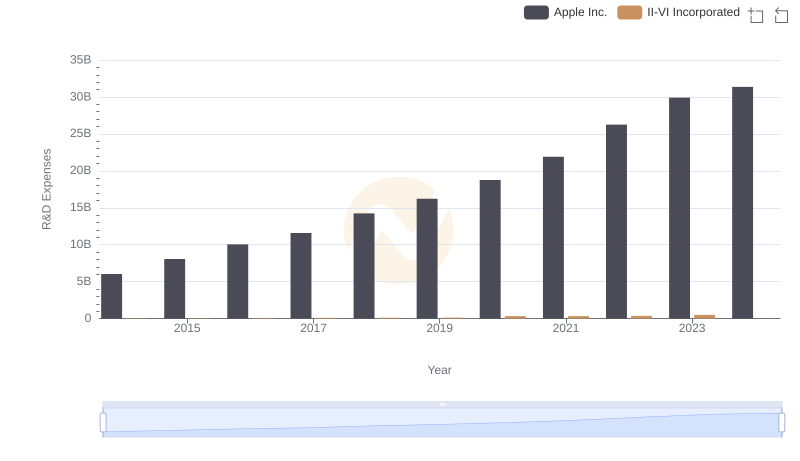
Research and Development Investment: Apple Inc. vs II-VI Incorporated
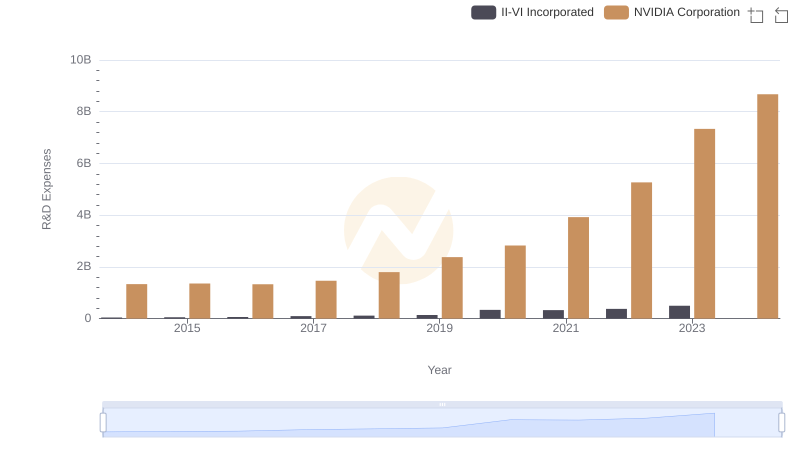
NVIDIA Corporation or II-VI Incorporated: Who Invests More in Innovation?
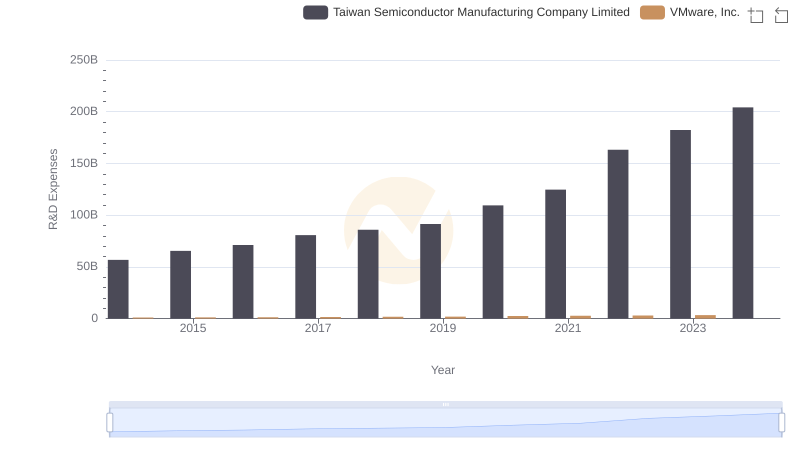
R&D Insights: How Taiwan Semiconductor Manufacturing Company Limited and VMware, Inc. Allocate Funds
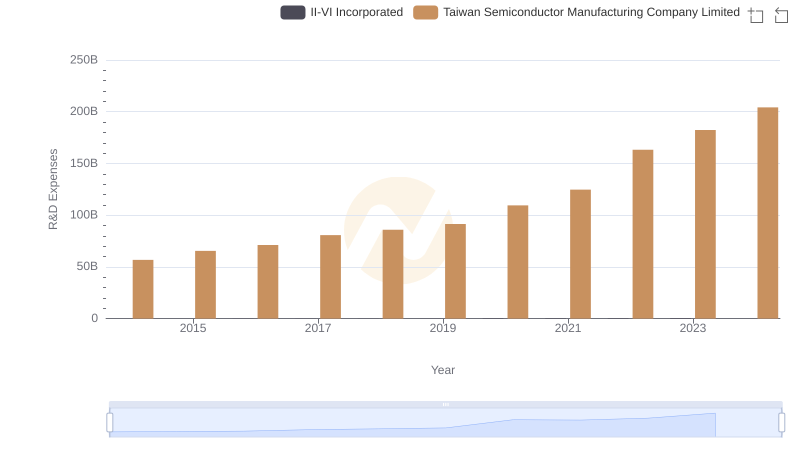
Research and Development Expenses Breakdown: Taiwan Semiconductor Manufacturing Company Limited vs II-VI Incorporated
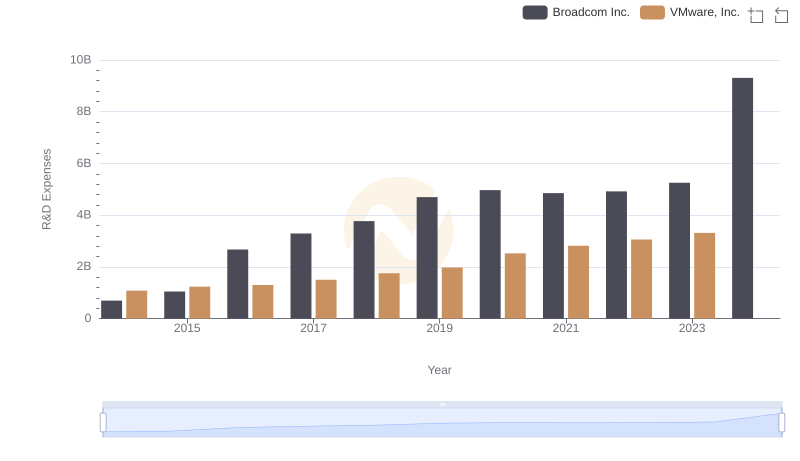
Broadcom Inc. vs VMware, Inc.: Strategic Focus on R&D Spending
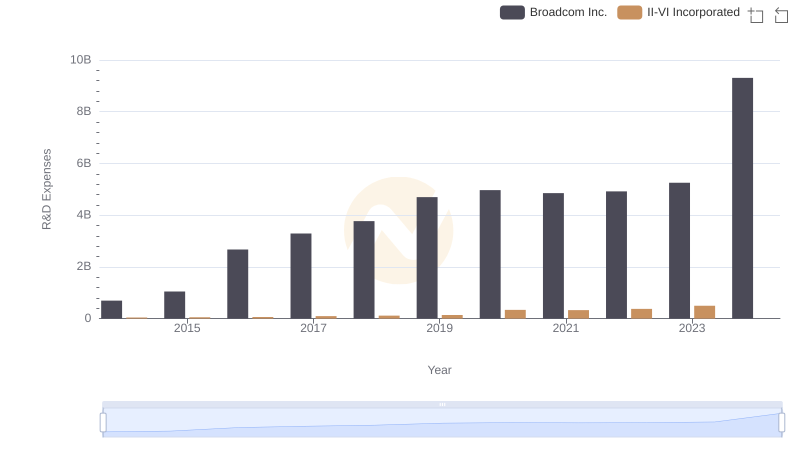
Broadcom Inc. vs II-VI Incorporated: Strategic Focus on R&D Spending
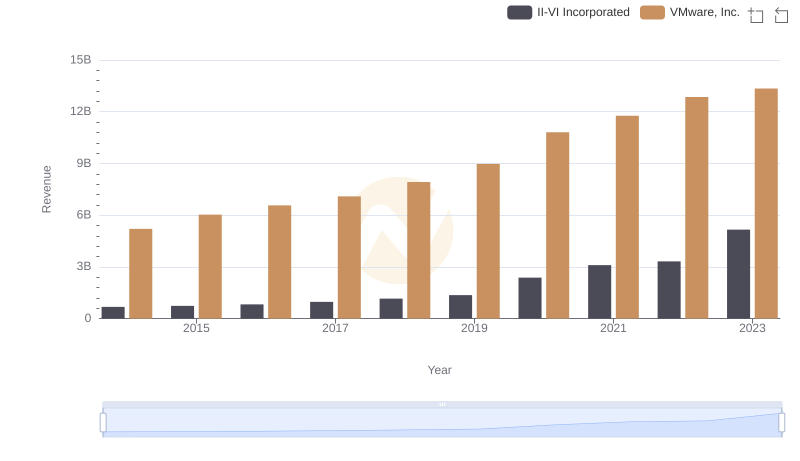
VMware, Inc. vs II-VI Incorporated: Examining Key Revenue Metrics
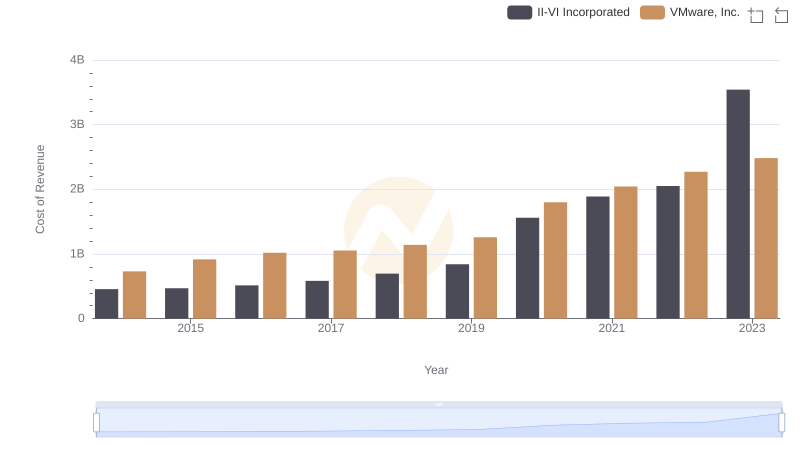
Cost of Revenue Comparison: VMware, Inc. vs II-VI Incorporated
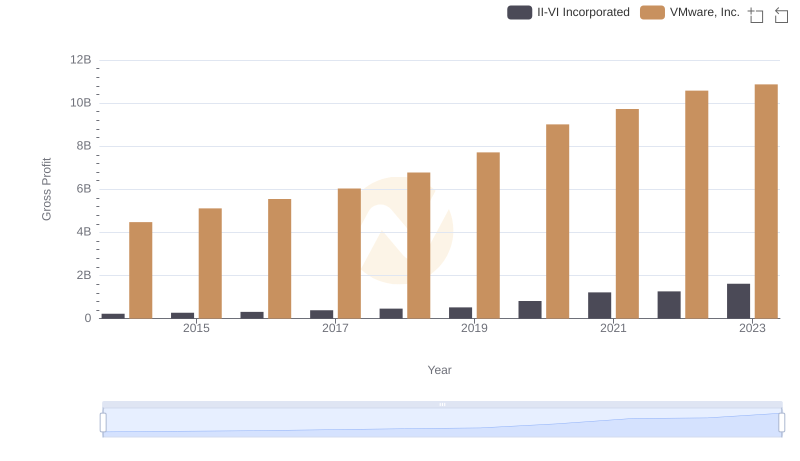
Gross Profit Analysis: Comparing VMware, Inc. and II-VI Incorporated
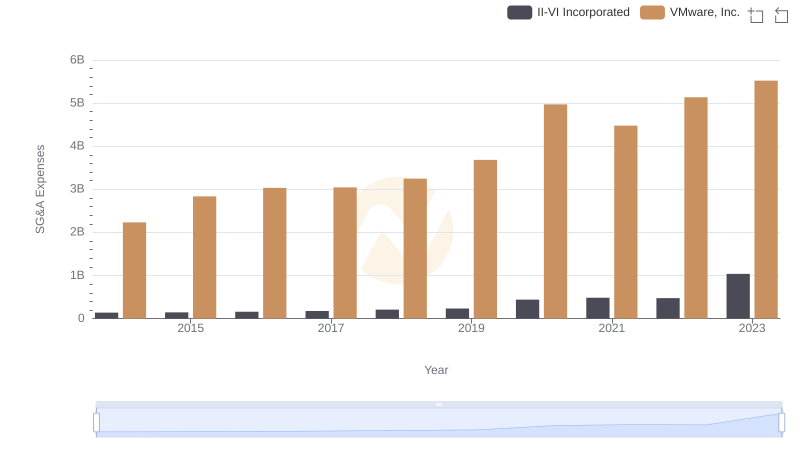
Who Optimizes SG&A Costs Better? VMware, Inc. or II-VI Incorporated
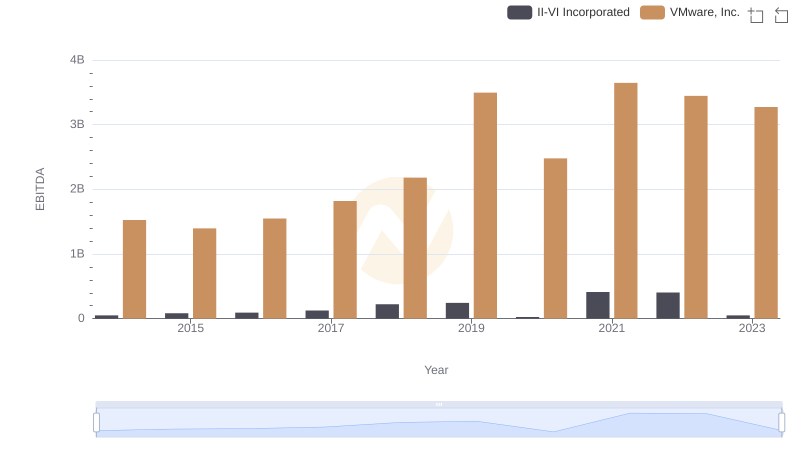
EBITDA Performance Review: VMware, Inc. vs II-VI Incorporated