| __timestamp | II-VI Incorporated | VMware, Inc. |
|---|---|---|
| Wednesday, January 1, 2014 | 456545000 | 730000000 |
| Thursday, January 1, 2015 | 470363000 | 917000000 |
| Friday, January 1, 2016 | 514403000 | 1018000000 |
| Sunday, January 1, 2017 | 583693000 | 1053000000 |
| Monday, January 1, 2018 | 696591000 | 1141000000 |
| Tuesday, January 1, 2019 | 841147000 | 1258000000 |
| Wednesday, January 1, 2020 | 1560521000 | 1799000000 |
| Friday, January 1, 2021 | 1889678000 | 2043000000 |
| Saturday, January 1, 2022 | 2051120000 | 2271000000 |
| Sunday, January 1, 2023 | 3541817000 | 2482000000 |
| Monday, January 1, 2024 | 3251724000 |
Cracking the code
In the ever-evolving tech landscape, understanding cost structures is crucial. This chart compares the cost of revenue for VMware, Inc. and II-VI Incorporated from 2014 to 2023. Over this period, VMware's cost of revenue grew by approximately 240%, while II-VI Incorporated saw a staggering increase of over 670%.
In 2014, VMware's cost of revenue was about 60% higher than II-VI's. However, by 2023, II-VI's cost of revenue had surpassed VMware's by nearly 43%. This shift highlights II-VI's aggressive expansion and investment in its operations.
For investors and analysts, these trends offer insights into each company's strategic priorities. VMware's steady growth reflects its focus on maintaining a balanced cost structure, while II-VI's rapid increase suggests a strategy centered on scaling and market penetration.
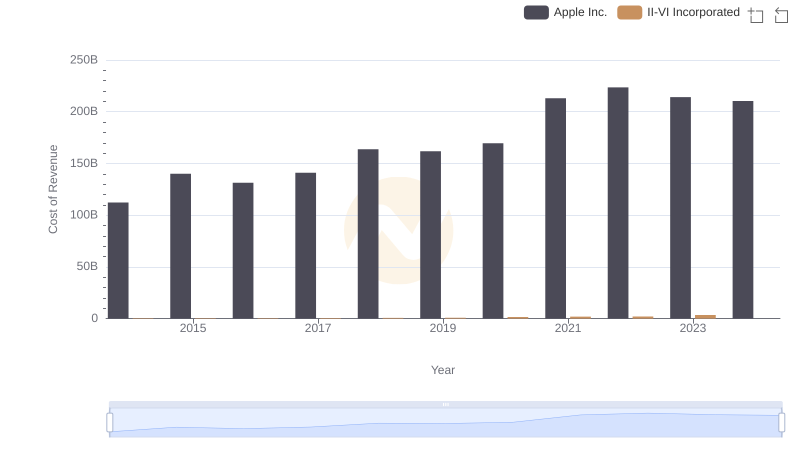
Cost of Revenue Comparison: Apple Inc. vs II-VI Incorporated
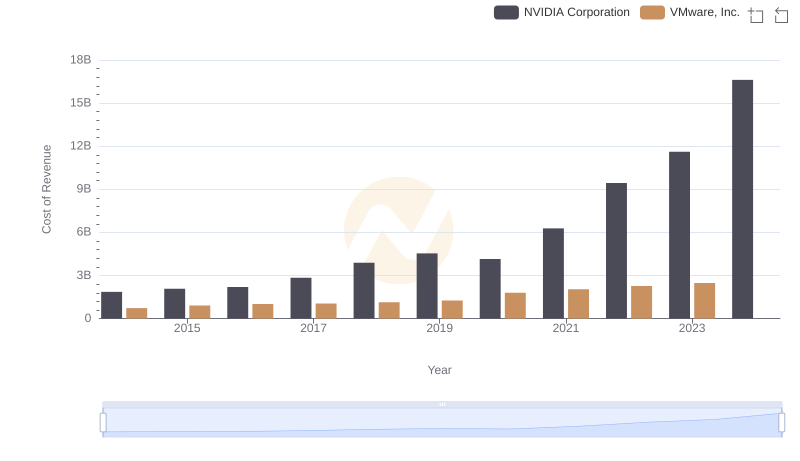
Cost of Revenue Trends: NVIDIA Corporation vs VMware, Inc.
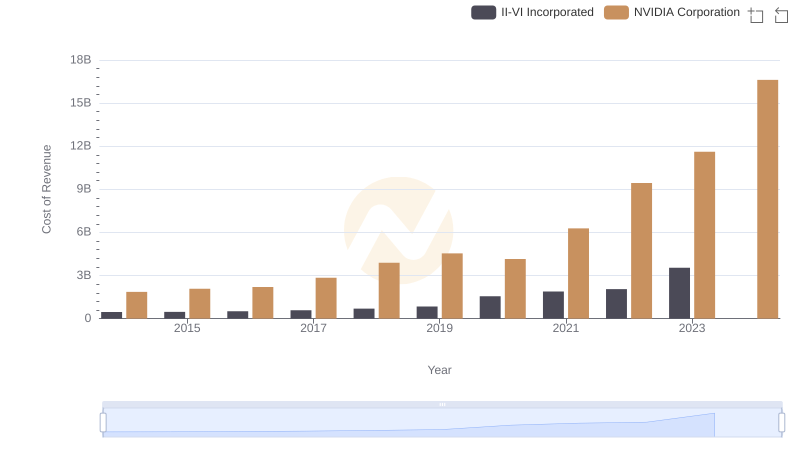
Cost of Revenue Trends: NVIDIA Corporation vs II-VI Incorporated
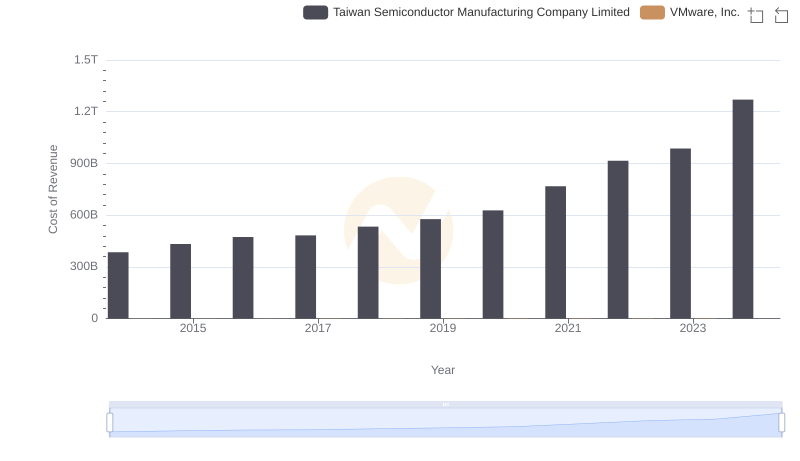
Cost of Revenue Trends: Taiwan Semiconductor Manufacturing Company Limited vs VMware, Inc.
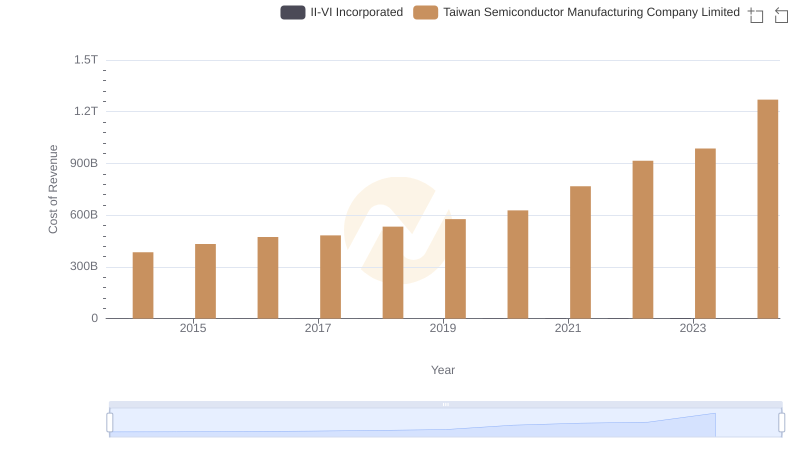
Cost of Revenue: Key Insights for Taiwan Semiconductor Manufacturing Company Limited and II-VI Incorporated
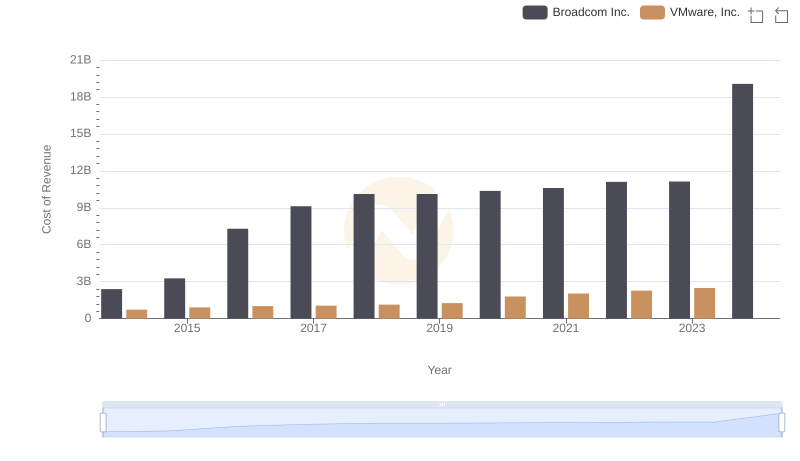
Analyzing Cost of Revenue: Broadcom Inc. and VMware, Inc.
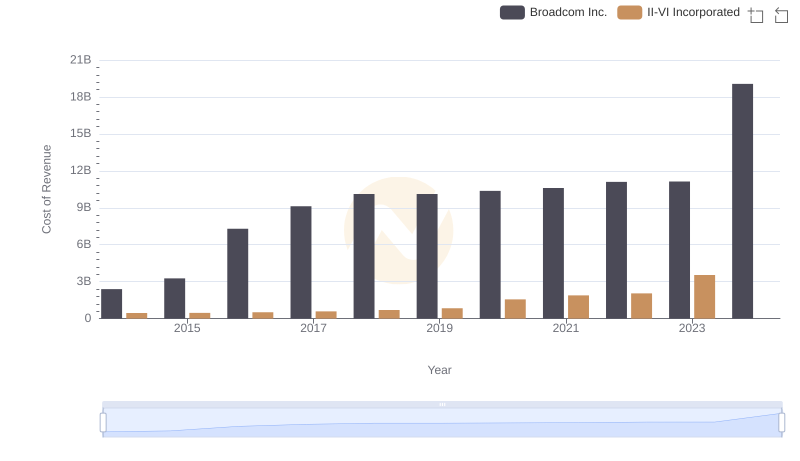
Broadcom Inc. vs II-VI Incorporated: Efficiency in Cost of Revenue Explored
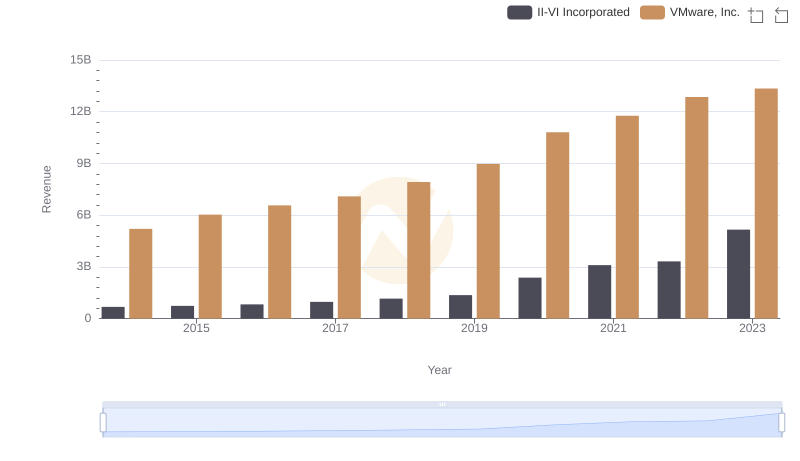
VMware, Inc. vs II-VI Incorporated: Examining Key Revenue Metrics
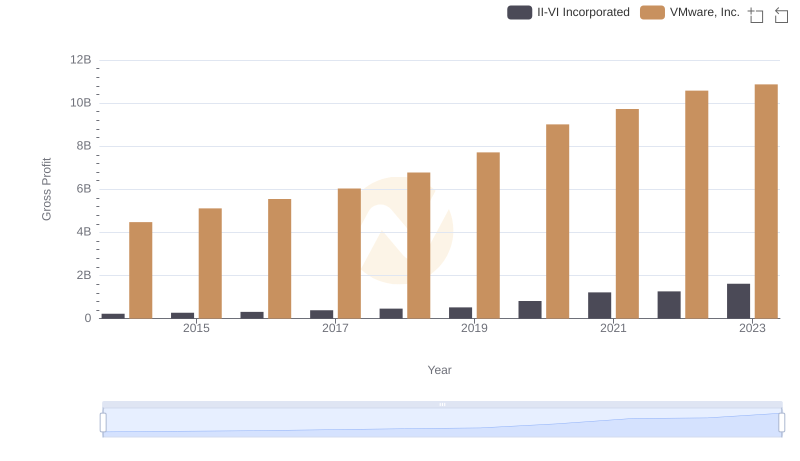
Gross Profit Analysis: Comparing VMware, Inc. and II-VI Incorporated
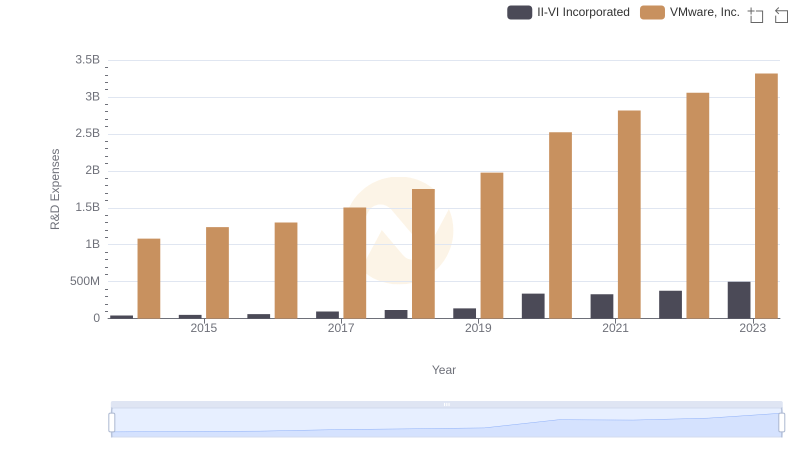
Comparing Innovation Spending: VMware, Inc. and II-VI Incorporated
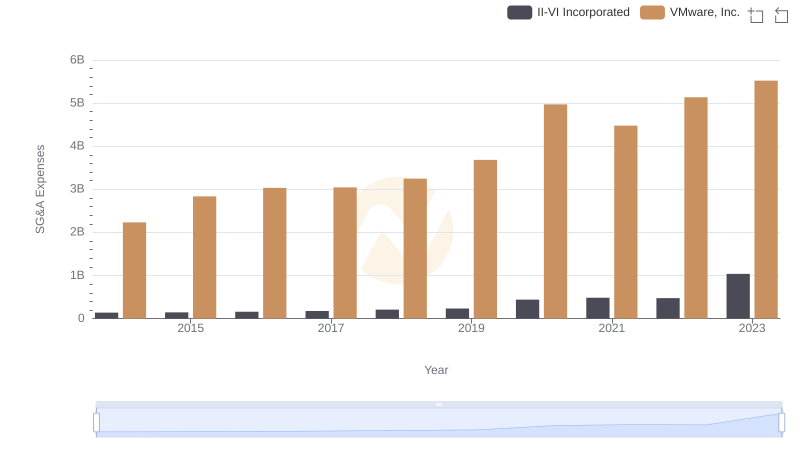
Who Optimizes SG&A Costs Better? VMware, Inc. or II-VI Incorporated
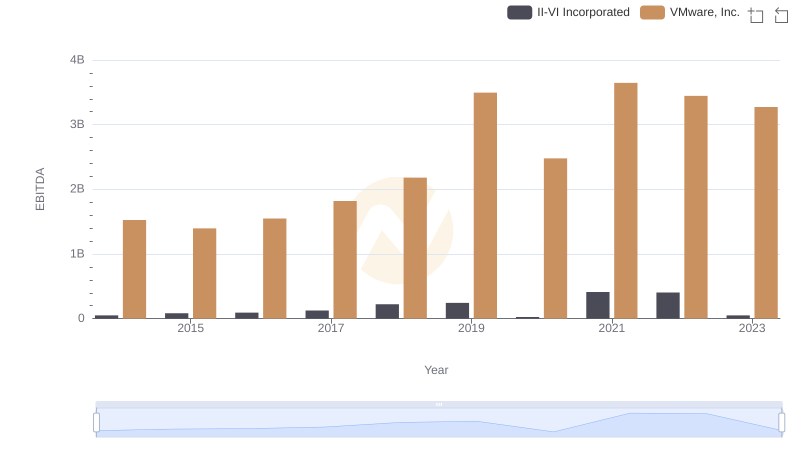
EBITDA Performance Review: VMware, Inc. vs II-VI Incorporated